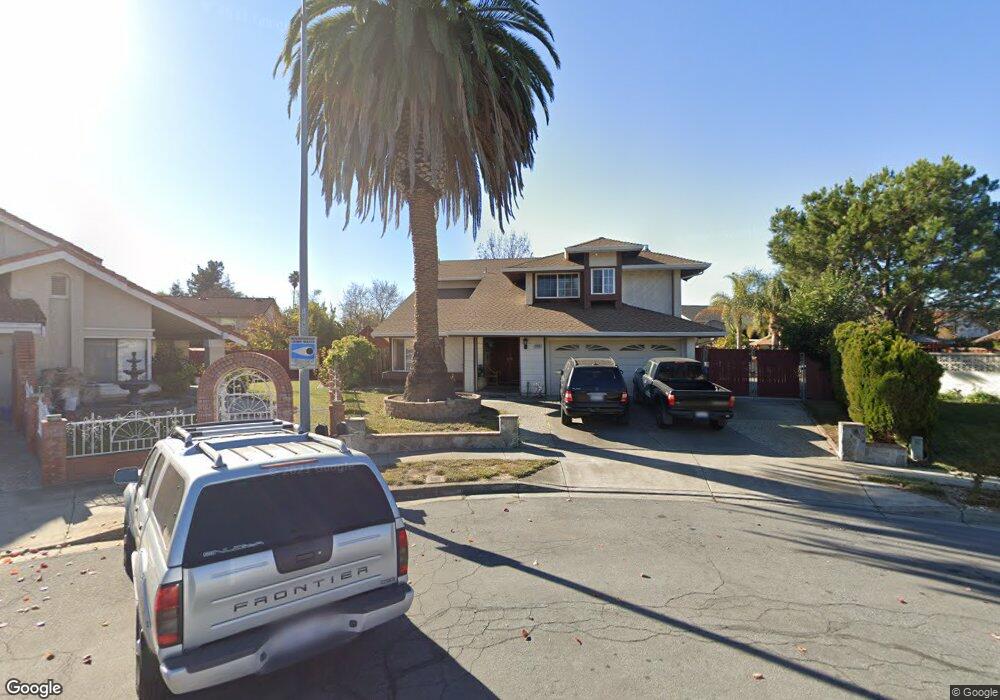
32895 Bluebird Loop Fremont, CA 94555
Alvarado NeighborhoodEstimated Value: $2,135,000 - $2,681,000
5
Beds
3
Baths
2,762
Sq Ft
$880/Sq Ft
Est. Value
About This Home
This home is located at 32895 Bluebird Loop, Fremont, CA 94555 and is currently estimated at $2,430,056, approximately $879 per square foot. 32895 Bluebird Loop is a home located in Alameda County with nearby schools including Ardenwood Elementary, Thornton Middle School, and American High School.
Ownership History
Date
Name
Owned For
Owner Type
Purchase Details
Closed on
Jan 8, 1999
Sold by
Li Felix C and Li Elena
Bought by
Oyenuga Sally T
Current Estimated Value
Home Financials for this Owner
Home Financials are based on the most recent Mortgage that was taken out on this home.
Original Mortgage
$336,000
Outstanding Balance
$77,732
Interest Rate
6.73%
Estimated Equity
$2,352,324
Purchase Details
Closed on
Jan 7, 1999
Sold by
Oyenuga Dotun A
Bought by
Oyenuga Sally T
Home Financials for this Owner
Home Financials are based on the most recent Mortgage that was taken out on this home.
Original Mortgage
$336,000
Outstanding Balance
$77,732
Interest Rate
6.73%
Estimated Equity
$2,352,324
Purchase Details
Closed on
Oct 4, 1995
Sold by
Arcayena Daniel M and Arcayena Daniel P
Bought by
Li Felix C and Li Elena
Home Financials for this Owner
Home Financials are based on the most recent Mortgage that was taken out on this home.
Original Mortgage
$315,000
Interest Rate
7.8%
Create a Home Valuation Report for This Property
The Home Valuation Report is an in-depth analysis detailing your home's value as well as a comparison with similar homes in the area
Home Values in the Area
Average Home Value in this Area
Purchase History
| Date | Buyer | Sale Price | Title Company |
|---|---|---|---|
| Oyenuga Sally T | $420,000 | Chicago Title Co | |
| Oyenuga Sally T | -- | Chicago Title Co | |
| Li Felix C | $350,000 | Fidelity National Title Ins |
Source: Public Records
Mortgage History
| Date | Status | Borrower | Loan Amount |
|---|---|---|---|
| Open | Oyenuga Sally T | $336,000 | |
| Previous Owner | Li Felix C | $315,000 | |
| Closed | Oyenuga Sally T | $21,000 |
Source: Public Records
Tax History Compared to Growth
Tax History
| Year | Tax Paid | Tax Assessment Tax Assessment Total Assessment is a certain percentage of the fair market value that is determined by local assessors to be the total taxable value of land and additions on the property. | Land | Improvement |
|---|---|---|---|---|
| 2025 | $8,054 | $651,400 | $197,520 | $460,880 |
| 2024 | $8,054 | $638,493 | $193,648 | $451,845 |
| 2023 | $7,832 | $632,838 | $189,851 | $442,987 |
| 2022 | $7,723 | $613,431 | $186,129 | $434,302 |
| 2021 | $7,535 | $601,268 | $182,480 | $425,788 |
| 2020 | $7,531 | $602,031 | $180,609 | $421,422 |
| 2019 | $7,446 | $590,230 | $177,069 | $413,161 |
| 2018 | $7,299 | $578,658 | $173,597 | $405,061 |
| 2017 | $7,116 | $567,314 | $170,194 | $397,120 |
| 2016 | $6,990 | $556,193 | $166,858 | $389,335 |
| 2015 | $6,910 | $547,838 | $164,351 | $383,487 |
| 2014 | $6,854 | $537,108 | $161,132 | $375,976 |
Source: Public Records
Map
Nearby Homes
- 4231 Hanford St
- 32542 Lake Tana St
- 4210 Comet Cir
- 4243 Comet Cir
- 33157 Lake Superior Place
- 33283 Sunriver Common
- 33228 Jamie Cir
- 3501 Lake Ontario Dr
- 32814 Shaver Lake St
- 4511 Martin St
- 4532 Delores Dr
- 33010 Lake Mead Dr
- 3280 Grand Lake Dr
- 34102 Zaner Way
- 4141 Deep Creek Rd Unit 137
- 3257 Lake Mead Ct
- 4214 Saturn Way
- 32451 Regents Blvd
- 3270 Santa Sophia Way
- 33499 Quail Run Rd
- 32885 Bluebird Loop
- 32880 Falcon Dr
- 32900 Falcon Dr
- 32905 Bluebird Loop
- 32860 Falcon Dr
- 32920 Falcon Dr
- 32875 Bluebird Loop
- 32805 Bluebird Loop
- 32915 Bluebird Loop
- 32819 Bluebird Loop
- 32840 Falcon Dr
- 32940 Falcon Dr
- 32865 Bluebird Loop
- 32925 Bluebird Loop
- 32820 Falcon Dr
- 32855 Bluebird Loop
- 32975 Bluebird Loop
- 32965 Bluebird Loop
- 32955 Bluebird Loop
- 4120 Sedge St