Estimated Value: $358,981 - $405,000
3
Beds
2
Baths
1,834
Sq Ft
$208/Sq Ft
Est. Value
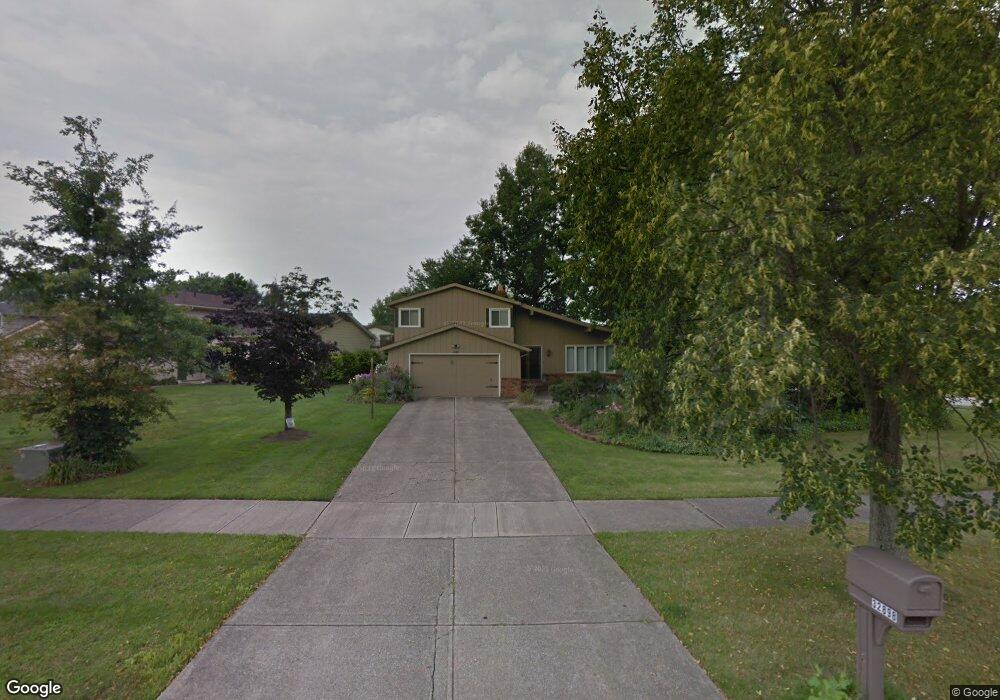
About This Home
This home is located at 32898 N Roundhead Dr, Solon, OH 44139 and is currently estimated at $381,245, approximately $207 per square foot. 32898 N Roundhead Dr is a home located in Cuyahoga County with nearby schools including Orchard Middle School, Grace L Roxbury Elementary School, and Solon Middle School.
Ownership History
Date
Name
Owned For
Owner Type
Purchase Details
Closed on
Mar 28, 2012
Sold by
Boone Cheryl
Bought by
Boone Courtney N
Current Estimated Value
Home Financials for this Owner
Home Financials are based on the most recent Mortgage that was taken out on this home.
Original Mortgage
$171,700
Outstanding Balance
$117,696
Interest Rate
3.75%
Mortgage Type
FHA
Estimated Equity
$263,549
Purchase Details
Closed on
May 17, 2000
Sold by
Minh Luu and Ngo Tien N
Bought by
Boone Cheryl
Home Financials for this Owner
Home Financials are based on the most recent Mortgage that was taken out on this home.
Original Mortgage
$135,200
Interest Rate
8.18%
Purchase Details
Closed on
Jul 24, 1992
Sold by
Hallman Janice L
Bought by
Luu Minh
Purchase Details
Closed on
Nov 20, 1986
Sold by
Ewing Frank I
Bought by
Hallman Janice L
Purchase Details
Closed on
Sep 22, 1980
Sold by
Allen Charles E
Bought by
Ewing Frank I
Purchase Details
Closed on
Sep 17, 1977
Sold by
Allen Charles E
Bought by
Allen Charles E
Purchase Details
Closed on
Apr 15, 1976
Bought by
Allen Charles E
Purchase Details
Closed on
Jan 1, 1975
Bought by
Solon Dev Co
Create a Home Valuation Report for This Property
The Home Valuation Report is an in-depth analysis detailing your home's value as well as a comparison with similar homes in the area
Home Values in the Area
Average Home Value in this Area
Purchase History
| Date | Buyer | Sale Price | Title Company |
|---|---|---|---|
| Boone Courtney N | $200,000 | None Available | |
| Boone Cheryl | $169,000 | -- | |
| Luu Minh | $135,000 | -- | |
| Hallman Janice L | $105,000 | -- | |
| Ewing Frank I | $93,000 | -- | |
| Allen Charles E | -- | -- | |
| Allen Charles E | $57,900 | -- | |
| Solon Dev Co | -- | -- |
Source: Public Records
Mortgage History
| Date | Status | Borrower | Loan Amount |
|---|---|---|---|
| Open | Boone Courtney N | $171,700 | |
| Previous Owner | Boone Cheryl | $135,200 |
Source: Public Records
Tax History
| Year | Tax Paid | Tax Assessment Tax Assessment Total Assessment is a certain percentage of the fair market value that is determined by local assessors to be the total taxable value of land and additions on the property. | Land | Improvement |
|---|---|---|---|---|
| 2024 | $6,091 | $111,300 | $24,745 | $86,555 |
| 2023 | $5,712 | $85,370 | $21,770 | $63,600 |
| 2022 | $5,829 | $85,370 | $21,770 | $63,600 |
| 2021 | $5,635 | $85,370 | $21,770 | $63,600 |
| 2020 | $5,222 | $72,350 | $18,450 | $53,900 |
| 2019 | $5,057 | $206,700 | $52,700 | $154,000 |
| 2018 | $4,528 | $72,350 | $18,450 | $53,900 |
| 2017 | $4,488 | $67,800 | $17,750 | $50,050 |
| 2016 | $4,446 | $67,800 | $17,750 | $50,050 |
| 2015 | $4,391 | $67,800 | $17,750 | $50,050 |
| 2014 | $4,391 | $64,580 | $16,910 | $47,670 |
Source: Public Records
Map
Nearby Homes
- 33014 N Roundhead Dr
- 32936 N Roundhead Dr
- 32985 Charmwood Oval
- 33071 N Burr Oak Dr
- 7471 Som Center Rd
- 32443 S Burr Oak Dr
- 6902 Kingswood Dr
- 33771 Canterbury Rd
- 35160 Spatterdock Ln
- 33346 Lisa Ln
- 6728 Edgemoor Ave
- 10397 W Cobblestone Ln
- 10424 Oviatt Ln
- 10240 Orchard Hill Ln Unit I23
- 10273 Luman Ln
- 7268 Annadale Dr
- 36725 Pettibone Rd
- 6531 Arbordale Ave
- 10132 Scenic View Dr
- 11241 Stanley Ln
- 32976 N Roundhead Dr
- 32860 N Roundhead Dr
- 32945 Roundhead Place
- 32867 N Roundhead Dr
- 32905 N Roundhead Dr
- 32762 Washington Ct Unit 62
- 32764 Washington Ct Unit 64
- 32766 Washington Ct
- 32760 Washington Ct
- 32766 Washington Ct Unit 66
- 32833 Cromwell Dr
- 32699 Jefferson Dr Unit 99
- 32697 Jefferson Dr Unit 97
- 32695 Jefferson Dr
- 32693 Jefferson Dr
- 32693 Jefferson Dr Unit 93
- 32820 N Roundhead Dr
- 33054 N Roundhead Dr
- 32983 Roundhead Place
- 32870 Cromwell Dr
Your Personal Tour Guide
Ask me questions while you tour the home.