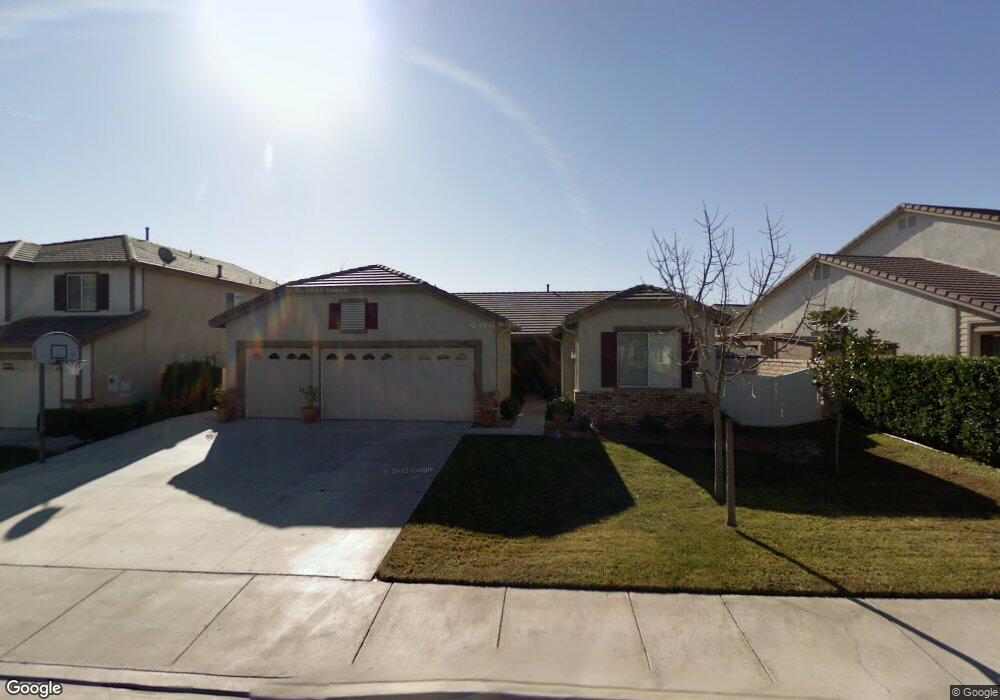
32899 Freesia Way Temecula, CA 92592
Vail Ranch NeighborhoodEstimated Value: $695,196 - $843,000
4
Beds
2
Baths
2,076
Sq Ft
$380/Sq Ft
Est. Value
About This Home
This home is located at 32899 Freesia Way, Temecula, CA 92592 and is currently estimated at $788,049, approximately $379 per square foot. 32899 Freesia Way is a home located in Riverside County with nearby schools including Pauba Valley Elementary School, Vail Ranch Middle School, and Great Oak High School.
Ownership History
Date
Name
Owned For
Owner Type
Purchase Details
Closed on
Mar 15, 2024
Sold by
Mauldin Read Sandra
Bought by
Read Sandra Mauldin and Read Adam Arthur
Current Estimated Value
Home Financials for this Owner
Home Financials are based on the most recent Mortgage that was taken out on this home.
Original Mortgage
$100,000
Outstanding Balance
$93,490
Interest Rate
5.9%
Mortgage Type
Construction
Estimated Equity
$694,559
Purchase Details
Closed on
Mar 17, 1998
Sold by
Centex Homes
Bought by
Mauldin Sandra J
Home Financials for this Owner
Home Financials are based on the most recent Mortgage that was taken out on this home.
Original Mortgage
$128,750
Interest Rate
7.17%
Create a Home Valuation Report for This Property
The Home Valuation Report is an in-depth analysis detailing your home's value as well as a comparison with similar homes in the area
Home Values in the Area
Average Home Value in this Area
Purchase History
| Date | Buyer | Sale Price | Title Company |
|---|---|---|---|
| Read Sandra Mauldin | -- | Stewart Title Guaranty Company | |
| Mauldin Sandra J | $170,500 | Fidelity National Title Ins |
Source: Public Records
Mortgage History
| Date | Status | Borrower | Loan Amount |
|---|---|---|---|
| Open | Read Sandra Mauldin | $100,000 | |
| Previous Owner | Mauldin Sandra J | $128,750 |
Source: Public Records
Tax History Compared to Growth
Tax History
| Year | Tax Paid | Tax Assessment Tax Assessment Total Assessment is a certain percentage of the fair market value that is determined by local assessors to be the total taxable value of land and additions on the property. | Land | Improvement |
|---|---|---|---|---|
| 2025 | $3,539 | $324,811 | $63,847 | $260,964 |
| 2023 | $3,539 | $260,874 | $61,369 | $199,505 |
| 2022 | $3,428 | $255,760 | $60,166 | $195,594 |
| 2021 | $3,354 | $250,746 | $58,987 | $191,759 |
| 2020 | $3,310 | $248,176 | $58,383 | $189,793 |
| 2019 | $3,269 | $243,311 | $57,239 | $186,072 |
| 2018 | $3,204 | $238,541 | $56,118 | $182,423 |
| 2017 | $3,147 | $233,865 | $55,018 | $178,847 |
| 2016 | $3,091 | $229,281 | $53,940 | $175,341 |
| 2015 | $3,037 | $225,839 | $53,131 | $172,708 |
| 2014 | $2,947 | $221,418 | $52,092 | $169,326 |
Source: Public Records
Map
Nearby Homes
- 32908 Freesia Way
- 45127 Tioga St
- 45211 Tioga St
- 32594 Strigel Ct
- 45316 Saint Tisbury St
- 45344 Saint Tisbury St
- 45435 Tioga St
- 44822 Camino Alamosa
- 45339 Tiburcio Dr
- 32815 Cleveland St
- 45381 Tiburcio Dr
- 44738 Corte Gutierrez
- 44690 Calle Lopez
- 45413 Eagle Crest Ln
- 33429 Barrington Dr
- 32095 Via Cordoba
- 32122 Corte Eldorado
- 32771 Rovato St
- 45250 Oakville Ct
- 45844 Corte Mislanca
- 32875 Freesia Way
- 32911 Freesia Way
- 32955 Regina Dr
- 32863 Freesia Way
- 45070 Karie Way
- 45080 Karie Way
- 32963 Regina Dr
- 32896 Freesia Way
- 32884 Freesia Way
- 44090 Karie Way
- 44080 Karie Way
- 44070 Karie Way
- 32872 Freesia Way
- 32920 Freesia Way
- 45090 Karie Way
- 32860 Freesia Way
- 32971 Regina Dr
- 32956 Regina Dr
- 32948 Regina Dr
- 45055 Karie Way