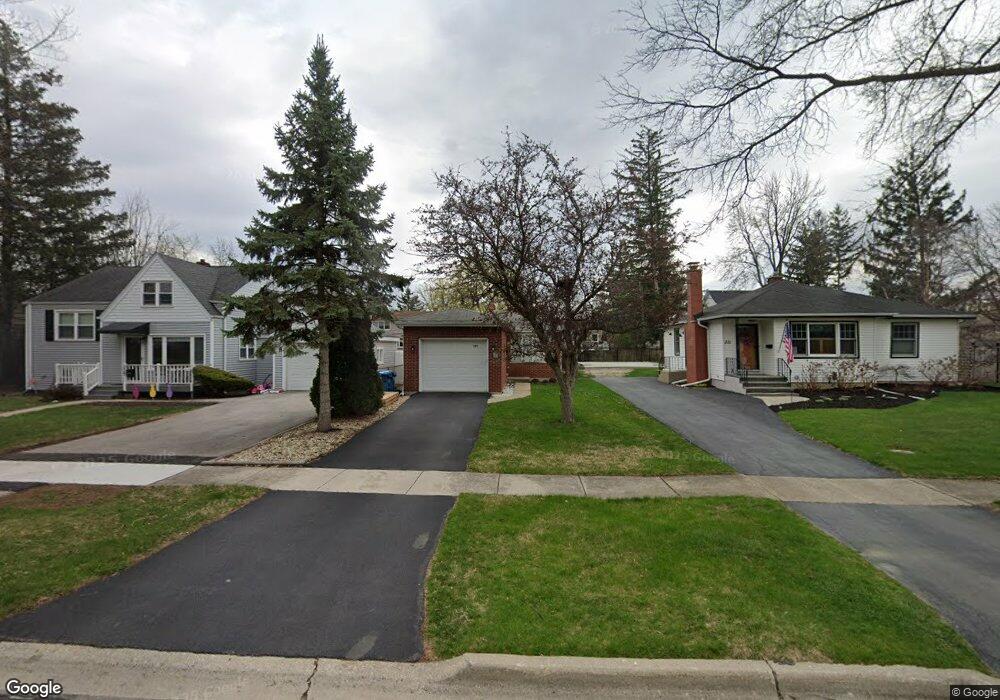
329 7th St Downers Grove, IL 60515
Estimated Value: $248,000 - $349,021
--
Bed
--
Bath
1,077
Sq Ft
$296/Sq Ft
Est. Value
About This Home
This home is located at 329 7th St, Downers Grove, IL 60515 and is currently estimated at $318,505, approximately $295 per square foot. 329 7th St is a home located in DuPage County with nearby schools including Whittier Elementary School, Herrick Middle School, and Downer Grove North High School.
Ownership History
Date
Name
Owned For
Owner Type
Purchase Details
Closed on
Sep 26, 2013
Sold by
Oswalt Richard and Copp Trust
Bought by
Karpowicz Stephen and Karpowicz Linda
Current Estimated Value
Purchase Details
Closed on
Jan 19, 1995
Sold by
Firstar Bank Illinois
Bought by
Frohlich Laurie J
Home Financials for this Owner
Home Financials are based on the most recent Mortgage that was taken out on this home.
Original Mortgage
$78,700
Interest Rate
9.28%
Create a Home Valuation Report for This Property
The Home Valuation Report is an in-depth analysis detailing your home's value as well as a comparison with similar homes in the area
Home Values in the Area
Average Home Value in this Area
Purchase History
| Date | Buyer | Sale Price | Title Company |
|---|---|---|---|
| Karpowicz Stephen | $125,000 | Pntn | |
| Frohlich Laurie J | $105,000 | -- |
Source: Public Records
Mortgage History
| Date | Status | Borrower | Loan Amount |
|---|---|---|---|
| Previous Owner | Frohlich Laurie J | $78,700 |
Source: Public Records
Tax History Compared to Growth
Tax History
| Year | Tax Paid | Tax Assessment Tax Assessment Total Assessment is a certain percentage of the fair market value that is determined by local assessors to be the total taxable value of land and additions on the property. | Land | Improvement |
|---|---|---|---|---|
| 2024 | $4,063 | $78,974 | $31,992 | $46,982 |
| 2023 | $3,840 | $72,600 | $29,410 | $43,190 |
| 2022 | $3,772 | $70,090 | $28,390 | $41,700 |
| 2021 | $3,529 | $69,300 | $28,070 | $41,230 |
| 2020 | $3,459 | $67,920 | $27,510 | $40,410 |
| 2019 | $3,342 | $65,170 | $26,400 | $38,770 |
| 2018 | $3,181 | $61,660 | $26,290 | $35,370 |
| 2017 | $3,073 | $59,340 | $25,300 | $34,040 |
| 2016 | $3,003 | $56,640 | $24,150 | $32,490 |
| 2015 | $2,958 | $53,290 | $22,720 | $30,570 |
| 2014 | $2,953 | $51,810 | $22,090 | $29,720 |
| 2013 | $2,892 | $51,570 | $21,990 | $29,580 |
Source: Public Records
Map
Nearby Homes
- 232 55th St
- 5518 Wilcox Ave
- 5519 Fairview Ave
- 5316 Fairview Ave
- 128 8th St
- 5341 Grand Ave
- 425 Hill St
- 5632 Fairview Ave
- 305 3rd St
- 205 White Fawn Trail
- 5740 Raintree Ln
- 5836 Doe Cir Unit 11
- 500 Bunning Dr
- 5244 Benton Ave
- 315 S Park St
- 543 Burlington Ave Unit 112E
- 525 Bunning Dr
- 440 Lindley Ave
- 532 W 59th St
- 4947 Wilcox Ave