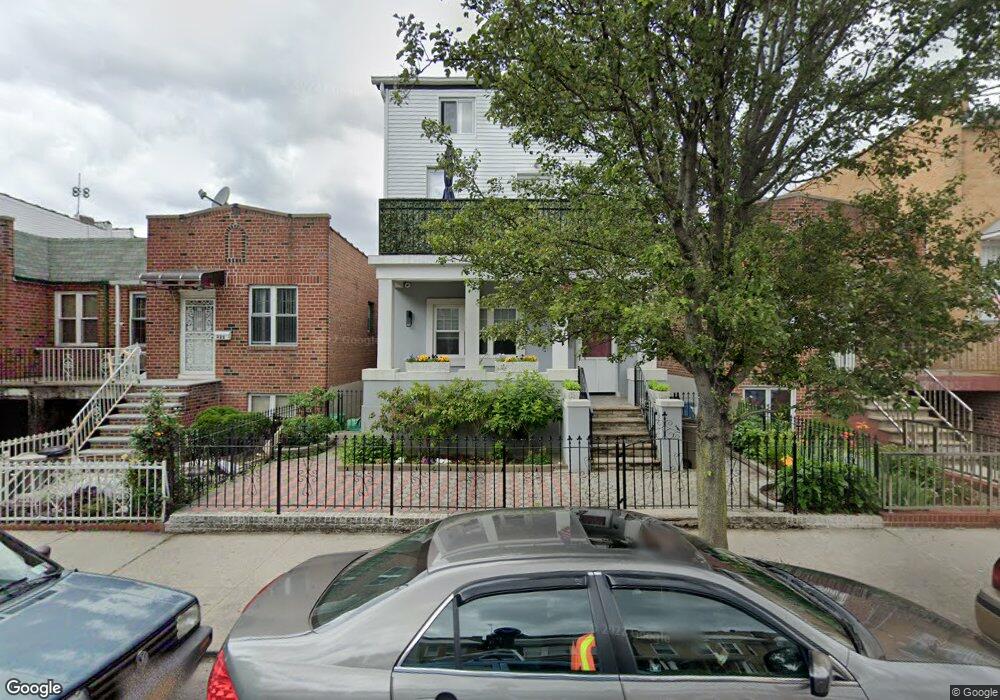
329 88th St Unit 2 Brooklyn, NY 11209
Fort Hamilton NeighborhoodEstimated Value: $1,402,000 - $1,918,316
--
Bed
1
Bath
2,880
Sq Ft
$570/Sq Ft
Est. Value
About This Home
This home is located at 329 88th St Unit 2, Brooklyn, NY 11209 and is currently estimated at $1,642,829, approximately $570 per square foot. 329 88th St Unit 2 is a home located in Kings County with nearby schools including P.S. 264 Bay Ridge Elementary School for the Arts, IS 201 Madeleine Brennan Intermediate School, and Fort Hamilton High School.
Ownership History
Date
Name
Owned For
Owner Type
Purchase Details
Closed on
Dec 9, 2016
Sold by
Carbone Lisa and Carbone Matthew
Bought by
Bfly Properties Llc
Current Estimated Value
Purchase Details
Closed on
Mar 29, 2006
Sold by
Carbone Matthew
Bought by
Carbone Lisa and Carbone Matthew
Purchase Details
Closed on
Mar 25, 2002
Sold by
Carbone Steve and Lamonica Frank
Bought by
Carbone Matthew
Home Financials for this Owner
Home Financials are based on the most recent Mortgage that was taken out on this home.
Original Mortgage
$300,000
Interest Rate
7.15%
Mortgage Type
Purchase Money Mortgage
Create a Home Valuation Report for This Property
The Home Valuation Report is an in-depth analysis detailing your home's value as well as a comparison with similar homes in the area
Home Values in the Area
Average Home Value in this Area
Purchase History
| Date | Buyer | Sale Price | Title Company |
|---|---|---|---|
| Bfly Properties Llc | $1,325,000 | -- | |
| Bfly Properties Llc | $1,325,000 | -- | |
| Carbone Lisa | -- | -- | |
| Carbone Lisa | -- | -- | |
| Carbone Matthew | -- | -- | |
| Carbone Matthew | -- | -- |
Source: Public Records
Mortgage History
| Date | Status | Borrower | Loan Amount |
|---|---|---|---|
| Previous Owner | Carbone Matthew | $300,000 | |
| Closed | Carbone Lisa | $0 |
Source: Public Records
Tax History Compared to Growth
Tax History
| Year | Tax Paid | Tax Assessment Tax Assessment Total Assessment is a certain percentage of the fair market value that is determined by local assessors to be the total taxable value of land and additions on the property. | Land | Improvement |
|---|---|---|---|---|
| 2025 | $12,178 | $111,000 | $18,900 | $92,100 |
| 2024 | $12,178 | $95,820 | $18,900 | $76,920 |
| 2023 | $11,617 | $98,280 | $18,900 | $79,380 |
| 2022 | $10,904 | $101,040 | $18,900 | $82,140 |
| 2021 | $10,952 | $80,400 | $18,900 | $61,500 |
| 2020 | $5,445 | $81,360 | $18,900 | $62,460 |
| 2019 | $10,737 | $90,000 | $18,900 | $71,100 |
| 2018 | $8,545 | $41,920 | $9,500 | $32,420 |
| 2017 | $8,107 | $39,770 | $10,252 | $29,518 |
| 2016 | $7,521 | $37,621 | $11,222 | $26,399 |
| 2015 | $4,305 | $37,621 | $16,838 | $20,783 |
| 2014 | $4,305 | $37,024 | $15,263 | $21,761 |
Source: Public Records
Map
Nearby Homes