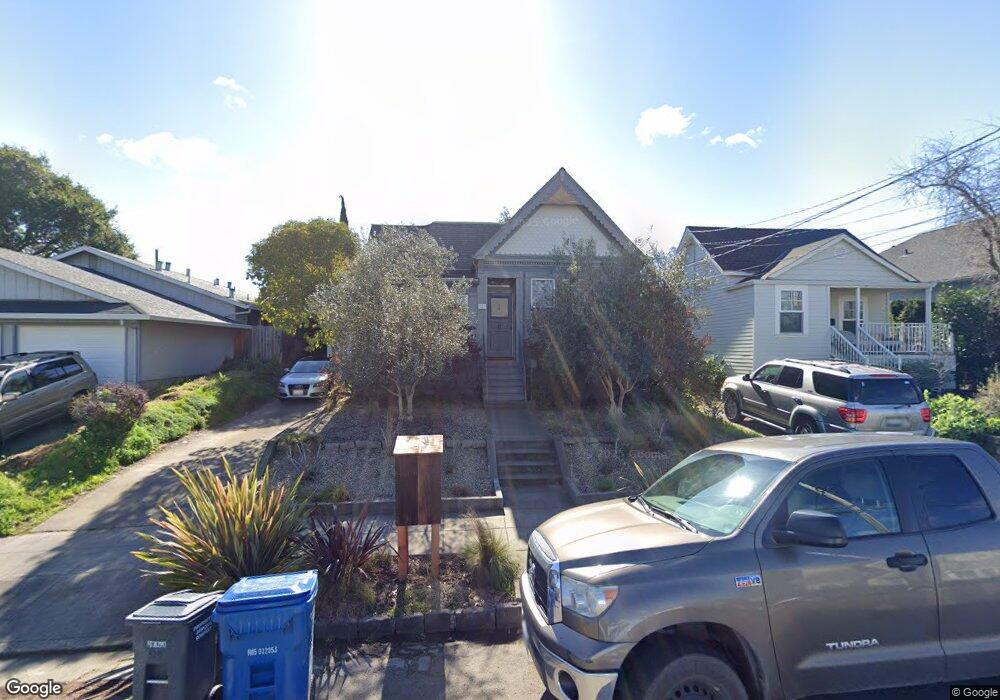
329 Bassett St Petaluma, CA 94952
Western Petaluma NeighborhoodEstimated Value: $891,000 - $989,000
3
Beds
1
Bath
1,309
Sq Ft
$732/Sq Ft
Est. Value
About This Home
This home is located at 329 Bassett St, Petaluma, CA 94952 and is currently estimated at $958,040, approximately $731 per square foot. 329 Bassett St is a home located in Sonoma County with nearby schools including Valley Vista Elementary School, Petaluma Junior High School, and Petaluma High School.
Ownership History
Date
Name
Owned For
Owner Type
Purchase Details
Closed on
Aug 22, 2025
Sold by
Brown Erio and Brown Jessica
Bought by
Brown Trust and Brown
Current Estimated Value
Purchase Details
Closed on
Oct 10, 2003
Sold by
Oconnor Joseph Richard and Oconnor Ann Kristine
Bought by
Brown Erio and Brown Jessica
Home Financials for this Owner
Home Financials are based on the most recent Mortgage that was taken out on this home.
Original Mortgage
$384,000
Interest Rate
3.64%
Mortgage Type
Purchase Money Mortgage
Create a Home Valuation Report for This Property
The Home Valuation Report is an in-depth analysis detailing your home's value as well as a comparison with similar homes in the area
Home Values in the Area
Average Home Value in this Area
Purchase History
| Date | Buyer | Sale Price | Title Company |
|---|---|---|---|
| Brown Trust | -- | None Listed On Document | |
| Brown Erio | $480,000 | North American Title Co |
Source: Public Records
Mortgage History
| Date | Status | Borrower | Loan Amount |
|---|---|---|---|
| Previous Owner | Brown Erio | $384,000 |
Source: Public Records
Tax History Compared to Growth
Tax History
| Year | Tax Paid | Tax Assessment Tax Assessment Total Assessment is a certain percentage of the fair market value that is determined by local assessors to be the total taxable value of land and additions on the property. | Land | Improvement |
|---|---|---|---|---|
| 2025 | $7,404 | $682,443 | $511,838 | $170,605 |
| 2024 | $7,404 | $669,062 | $501,802 | $167,260 |
| 2023 | $7,404 | $655,944 | $491,963 | $163,981 |
| 2022 | $7,168 | $643,083 | $482,317 | $160,766 |
| 2021 | $7,034 | $630,474 | $472,860 | $157,614 |
| 2020 | $7,094 | $624,010 | $468,012 | $155,998 |
| 2019 | $7,007 | $611,776 | $458,836 | $152,940 |
| 2018 | $6,981 | $599,782 | $449,840 | $149,942 |
| 2017 | $6,835 | $588,022 | $441,020 | $147,002 |
| 2016 | $6,674 | $576,493 | $432,373 | $144,120 |
| 2015 | $6,582 | $567,835 | $425,879 | $141,956 |
| 2014 | $6,550 | $556,713 | $417,537 | $139,176 |
Source: Public Records
Map
Nearby Homes