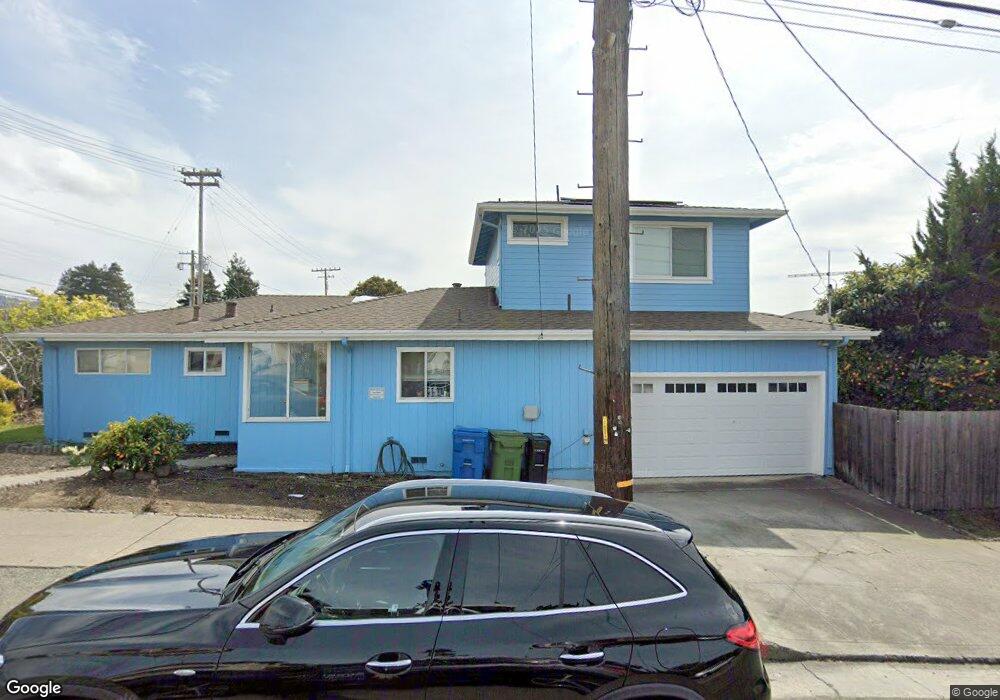
329 Behrens St El Cerrito, CA 94530
Estimated Value: $1,226,000 - $1,411,837
3
Beds
3
Baths
1,393
Sq Ft
$959/Sq Ft
Est. Value
About This Home
This home is located at 329 Behrens St, El Cerrito, CA 94530 and is currently estimated at $1,335,459, approximately $958 per square foot. 329 Behrens St is a home located in Contra Costa County with nearby schools including Harding Elementary School, Fred T. Korematsu Middle School, and El Cerrito Senior High School.
Ownership History
Date
Name
Owned For
Owner Type
Purchase Details
Closed on
Sep 28, 2022
Sold by
Ratner Paul A and Ratner Jessica N
Bought by
Nosanchuk-Ratnerrevocable Living Trust
Current Estimated Value
Purchase Details
Closed on
Jun 25, 2014
Sold by
Luo Zhi Jian and Luo Karen Hm Li
Bought by
Ratner Paul A and Nosanchuk Jessica N
Home Financials for this Owner
Home Financials are based on the most recent Mortgage that was taken out on this home.
Original Mortgage
$636,446
Interest Rate
4.17%
Mortgage Type
FHA
Purchase Details
Closed on
Jul 5, 2005
Sold by
Webber Janis C
Bought by
Luo Zhi Jian and Luo Karen Hm Li
Home Financials for this Owner
Home Financials are based on the most recent Mortgage that was taken out on this home.
Original Mortgage
$532,000
Interest Rate
5.75%
Mortgage Type
Fannie Mae Freddie Mac
Create a Home Valuation Report for This Property
The Home Valuation Report is an in-depth analysis detailing your home's value as well as a comparison with similar homes in the area
Home Values in the Area
Average Home Value in this Area
Purchase History
| Date | Buyer | Sale Price | Title Company |
|---|---|---|---|
| Nosanchuk-Ratnerrevocable Living Trust | -- | -- | |
| Ratner Paul A | $700,000 | North American Title Company | |
| Luo Zhi Jian | $665,000 | Commonwealth Title |
Source: Public Records
Mortgage History
| Date | Status | Borrower | Loan Amount |
|---|---|---|---|
| Previous Owner | Ratner Paul A | $636,446 | |
| Previous Owner | Luo Zhi Jian | $532,000 |
Source: Public Records
Tax History Compared to Growth
Tax History
| Year | Tax Paid | Tax Assessment Tax Assessment Total Assessment is a certain percentage of the fair market value that is determined by local assessors to be the total taxable value of land and additions on the property. | Land | Improvement |
|---|---|---|---|---|
| 2025 | $13,212 | $958,488 | $637,442 | $321,046 |
| 2024 | $12,973 | $939,695 | $624,944 | $314,751 |
| 2023 | $12,973 | $921,271 | $612,691 | $308,580 |
| 2022 | $12,796 | $903,208 | $600,678 | $302,530 |
| 2021 | $12,761 | $885,499 | $588,900 | $296,599 |
| 2019 | $11,308 | $806,736 | $571,434 | $235,302 |
| 2018 | $10,419 | $754,154 | $560,230 | $193,924 |
| 2017 | $10,255 | $739,368 | $549,246 | $190,122 |
| 2016 | $10,227 | $724,872 | $538,477 | $186,395 |
| 2015 | $10,271 | $713,985 | $530,389 | $183,596 |
| 2014 | $8,484 | $580,000 | $362,828 | $217,172 |
Source: Public Records
Map
Nearby Homes
- 444 Richmond St
- 506 Clayton Ave
- 417 Evelyn Ave Unit 205
- 556 Norvell St
- 606 Masonic Ave
- 618 Liberty St
- 518 Kains Ave Unit 103
- 1252 Portland Ave
- 609 San Carlos Ave
- 10300 San Pablo Ave Unit 303
- 10300 San Pablo Ave Unit 108
- 3014 Santa Clara Ave
- 5720 El Dorado Ave
- 935 Hillside Ave
- 785 Taft Ave Unit 10
- 840 Key Route Blvd
- 535 Pierce St Unit 3114
- 535 Pierce St Unit 1307
- 535 Pierce St Unit 2110
- 325 Behrens St
- 7014 Fairmount Ave
- 321 Behrens St
- 332 Victoria St
- 7015 Fairmount Ave
- 317 Behrens St
- 400 Norvell St
- 7023 Fairmount Ave
- 328 Victoria St
- 7100 Fairmount Ave
- 7031 Fairmount Ave
- 324 Behrens St
- 315 Behrens St
- 320 Victoria St
- 6927 Fairmount Ave
- 316 Behrens St
- 409 Albemarle St
- 316 Victoria St
- 314 Behrens St
- 6921 Fairmount Ave