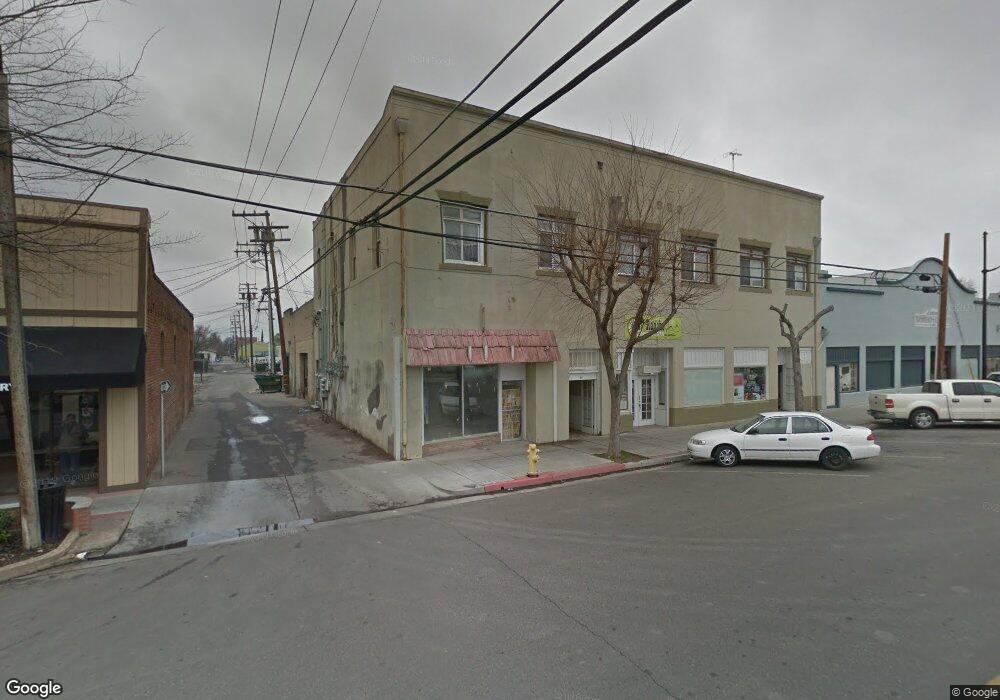
329 Heinlen St Lemoore, CA 93245
Estimated Value: $828,028
Studio
--
Bath
3,500
Sq Ft
$237/Sq Ft
Est. Value
About This Home
This home is located at 329 Heinlen St, Lemoore, CA 93245 and is currently estimated at $828,028, approximately $236 per square foot. 329 Heinlen St is a home located in Kings County with nearby schools including Lemoore Elementary School, Liberty Middle School, and Lemoore High School.
Ownership History
Date
Name
Owned For
Owner Type
Purchase Details
Closed on
Aug 14, 2023
Sold by
Dreamspal Llc
Bought by
Gallarde Kevin and Herrera Nayeli Aceves
Current Estimated Value
Home Financials for this Owner
Home Financials are based on the most recent Mortgage that was taken out on this home.
Original Mortgage
$640,000
Outstanding Balance
$622,886
Interest Rate
6.81%
Mortgage Type
Seller Take Back
Estimated Equity
$199,280
Purchase Details
Closed on
Sep 3, 2010
Sold by
Pal Nirupam and Guptapal Susmita
Bought by
Dreamspal Llc
Purchase Details
Closed on
Nov 17, 2006
Sold by
Ochoa Maria and Estate Of Samuel Ochoa Jr
Bought by
Pal Nirupam and Guptapal Susmita
Home Financials for this Owner
Home Financials are based on the most recent Mortgage that was taken out on this home.
Original Mortgage
$209,000
Interest Rate
6.16%
Mortgage Type
Commercial
Create a Home Valuation Report for This Property
The Home Valuation Report is an in-depth analysis detailing your home's value as well as a comparison with similar homes in the area
Home Values in the Area
Average Home Value in this Area
Purchase History
We collect this data history from publicly available records. To have your information removed, we recommend requesting removal directly through your county’s website.
| Date | Buyer | Sale Price | Title Company |
|---|---|---|---|
| Gallarde Kevin | $800,000 | Stewart Title Of California | |
| Dreamspal Llc | -- | None Available | |
| Pal Nirupam | $300,000 | Financial Title Company |
Source: Public Records
Mortgage History
We collect this data history from publicly available records. To have your information removed, we recommend requesting removal directly through your county’s website.
| Date | Status | Borrower | Loan Amount |
|---|---|---|---|
| Open | Gallarde Kevin | $640,000 | |
| Previous Owner | Pal Nirupam | $209,000 |
Source: Public Records
Tax History
| Year | Tax Paid | Tax Assessment Tax Assessment Total Assessment is a certain percentage of the fair market value that is determined by local assessors to be the total taxable value of land and additions on the property. | Land | Improvement |
|---|---|---|---|---|
| 2025 | $8,278 | $816,000 | $54,060 | $761,940 |
| 2023 | $8,278 | $386,329 | $112,681 | $273,648 |
| 2022 | $4,279 | $378,755 | $110,472 | $268,283 |
| 2021 | $4,171 | $371,329 | $108,306 | $263,023 |
| 2020 | $4,149 | $367,521 | $107,195 | $260,326 |
| 2019 | $4,117 | $360,315 | $105,093 | $255,222 |
| 2018 | $3,868 | $353,250 | $103,032 | $250,218 |
| 2017 | $3,877 | $346,324 | $101,012 | $245,312 |
| 2016 | $3,647 | $339,533 | $99,031 | $240,502 |
| 2015 | $3,632 | $334,432 | $97,543 | $236,889 |
| 2014 | $3,526 | $327,881 | $95,632 | $232,249 |
Source: Public Records
Map
Nearby Homes
- 309 Heinlen St Unit C
- 309 Heinlen St Unit E
- 309 Heinlen St Unit J
- 309 Heinlen St Unit F
- 309 Heinlen St Unit G
- 309 Heinlen St Unit D
- 309 Heinlen St
- 312 W D St
- 316 W D St
- 302 W D St
- 626 Heinlen St
- 338 W D St
- 314 Heinlen St
- 331 W D St
- 321 W D St
- 329 W D St
- 311 East Rd
- 344 W D St
- 321 E St
- 236 Heinlen St
Your Personal Tour Guide
Ask me questions while you tour the home.