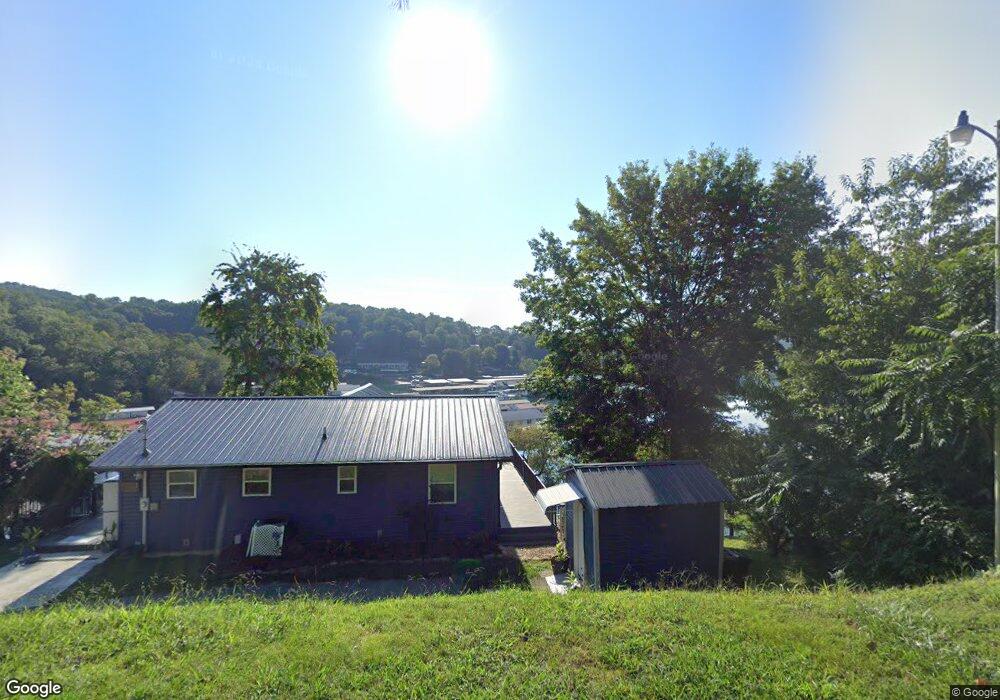
329 Lakesprings Dr La Follette, TN 37766
Estimated Value: $652,571 - $785,000
--
Bed
2
Baths
1,728
Sq Ft
$402/Sq Ft
Est. Value
About This Home
This home is located at 329 Lakesprings Dr, La Follette, TN 37766 and is currently estimated at $695,143, approximately $402 per square foot. 329 Lakesprings Dr is a home located in Campbell County.
Ownership History
Date
Name
Owned For
Owner Type
Purchase Details
Closed on
Dec 24, 2020
Sold by
Reed Kenneth J and Reed Barbara L
Bought by
Buschur Timothy J and Buschur Misty
Current Estimated Value
Home Financials for this Owner
Home Financials are based on the most recent Mortgage that was taken out on this home.
Original Mortgage
$333,000
Outstanding Balance
$296,998
Interest Rate
2.8%
Mortgage Type
New Conventional
Estimated Equity
$398,145
Purchase Details
Closed on
Nov 22, 2000
Sold by
Kingseed Bernice
Bought by
Reed Kenneth
Purchase Details
Closed on
May 10, 1999
Sold by
Asbury Lee and Asbury Joan
Bought by
Kingseed Bernice
Purchase Details
Closed on
Jan 26, 1998
Sold by
Taylor Hershell
Bought by
Asbury Lee
Purchase Details
Closed on
Jun 27, 1996
Sold by
Bromagene Kent E
Bought by
Taylor Hershel
Purchase Details
Closed on
Jan 15, 1991
Bought by
Bromagene Kent E and Bromagene Sharon L
Purchase Details
Closed on
Jun 13, 1989
Bought by
Back Robert
Purchase Details
Closed on
Jun 12, 1984
Bought by
Keen Ralph A and Keen Clara
Purchase Details
Closed on
Aug 18, 1980
Create a Home Valuation Report for This Property
The Home Valuation Report is an in-depth analysis detailing your home's value as well as a comparison with similar homes in the area
Home Values in the Area
Average Home Value in this Area
Purchase History
| Date | Buyer | Sale Price | Title Company |
|---|---|---|---|
| Buschur Timothy J | $385,000 | None Available | |
| Reed Kenneth | $170,000 | -- | |
| Kingseed Bernice | $140,000 | -- | |
| Asbury Lee | $125,000 | -- | |
| Taylor Hershel | $100,000 | -- | |
| Bromagene Kent E | $56,000 | -- | |
| Back Robert | -- | -- | |
| Keen Ralph A | -- | -- | |
| -- | -- | -- |
Source: Public Records
Mortgage History
| Date | Status | Borrower | Loan Amount |
|---|---|---|---|
| Open | Buschur Timothy J | $333,000 |
Source: Public Records
Tax History Compared to Growth
Tax History
| Year | Tax Paid | Tax Assessment Tax Assessment Total Assessment is a certain percentage of the fair market value that is determined by local assessors to be the total taxable value of land and additions on the property. | Land | Improvement |
|---|---|---|---|---|
| 2025 | $1,772 | $145,775 | $0 | $0 |
| 2024 | $1,772 | $145,775 | $46,575 | $99,200 |
| 2023 | $1,341 | $64,900 | $24,750 | $40,150 |
| 2022 | $1,341 | $64,900 | $24,750 | $40,150 |
| 2021 | $1,341 | $64,900 | $24,750 | $40,150 |
| 2020 | $1,314 | $64,900 | $24,750 | $40,150 |
| 2019 | $1,341 | $64,900 | $24,750 | $40,150 |
| 2018 | $1,425 | $63,350 | $27,500 | $35,850 |
| 2017 | $1,280 | $56,900 | $27,500 | $29,400 |
| 2016 | $1,280 | $56,900 | $27,500 | $29,400 |
| 2015 | $1,132 | $56,900 | $27,500 | $29,400 |
| 2014 | $1,132 | $56,900 | $27,500 | $29,400 |
| 2013 | -- | $56,900 | $27,500 | $29,400 |
Source: Public Records
Map
Nearby Homes
- 309 Alder Shore Ln
- 0 Lakesprings Dr Unit 1315301
- 150 E Harbor View Ln
- 118 E Harbor View Ln Unit A
- 118 E Harbor View Ln Unit B
- 207 N Deer Hill Village Unit A
- 135 N Deer Hill Village Ln Unit A
- 131 N Deer Village Ln Unit B
- 195 N Deer Village Ln Unit B
- 195 Kennedys Loop
- Lot 8 Chapman Rd
- Lot 3 Chapman Rd
- Lot 2 Chapman Rd
- Lot 7 Chapman Rd
- Lot 6 Chapman Rd
- Lot 9 Chapman Rd
- Lot 1 Chapman Rd
- Lot 4 Chapman Rd
- Lot 5 Chapman Rd
- 163 N Deer Village Ln
- 345 Lakesprings Dr
- 315 Lakesprings Dr
- 361 Lakesprings Dr
- 371 Lakesprings Dr
- 352 Spring View Dr Unit DEER
- 293 Lakesprings Dr
- 670 Alder Springs Rd
- 670 Alder Springs Rd
- 670 Alder Springs Rd
- 670 Alder Springs Rd
- 670 Alder Springs Rd
- 670 Alder Springs Rd
- 670 Alder Springs Rd
- 670 Alder Springs Rd
- 670 Alder Springs Rd
- 389 Lakesprings Dr
- 0 Anchor Ln Unit 1130204
- 272 Lakesprings Dr
- 273 Lakesprings Dr
- 165 Lake Springs Dr