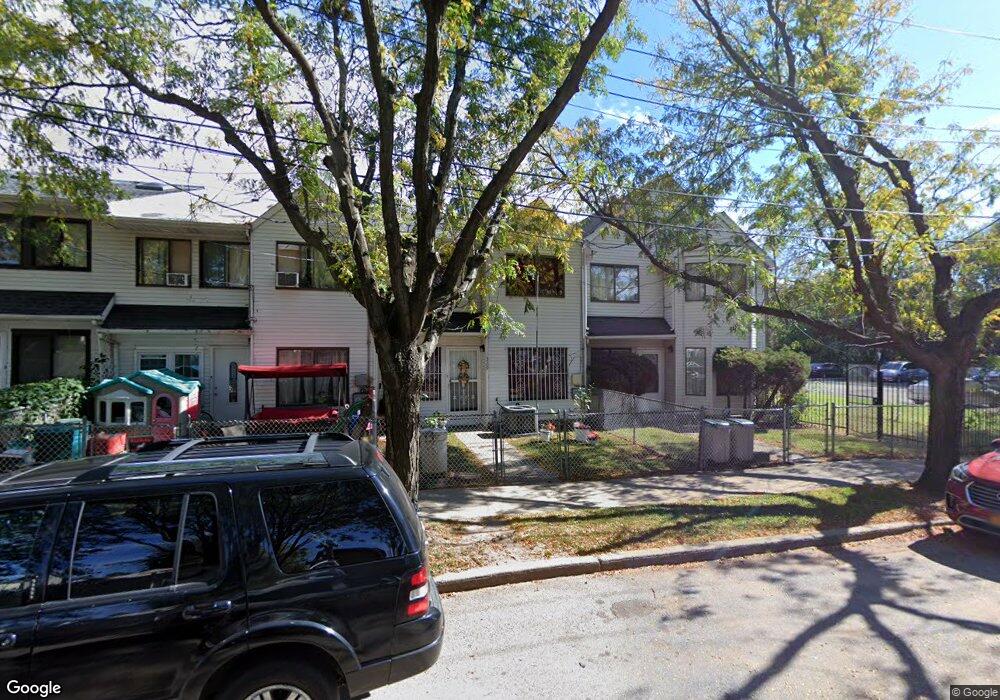
329 Mersereau Ave Unit A Staten Island, NY 10303
Mariners Harbor NeighborhoodEstimated Value: $427,644 - $471,000
2
Beds
2
Baths
920
Sq Ft
$482/Sq Ft
Est. Value
About This Home
This home is located at 329 Mersereau Ave Unit A, Staten Island, NY 10303 and is currently estimated at $443,161, approximately $481 per square foot. 329 Mersereau Ave Unit A is a home located in Richmond County with nearby schools including P.S. 44 Thomas C Brown, I.S. 51 Edwin Markham, and Port Richmond High School.
Ownership History
Date
Name
Owned For
Owner Type
Purchase Details
Closed on
Jun 18, 2021
Sold by
Persaud Raymond
Bought by
Amarasinghe Kasun S and Gedara Thakshila D
Current Estimated Value
Home Financials for this Owner
Home Financials are based on the most recent Mortgage that was taken out on this home.
Original Mortgage
$308,750
Outstanding Balance
$279,665
Interest Rate
2.93%
Mortgage Type
New Conventional
Estimated Equity
$163,496
Purchase Details
Closed on
Sep 25, 2002
Sold by
Jones Raymond and Jones Janice
Bought by
Persaud Raymond
Home Financials for this Owner
Home Financials are based on the most recent Mortgage that was taken out on this home.
Original Mortgage
$146,343
Interest Rate
6.34%
Mortgage Type
FHA
Create a Home Valuation Report for This Property
The Home Valuation Report is an in-depth analysis detailing your home's value as well as a comparison with similar homes in the area
Home Values in the Area
Average Home Value in this Area
Purchase History
| Date | Buyer | Sale Price | Title Company |
|---|---|---|---|
| Amarasinghe Kasun S | -- | Old Republic Title | |
| Persaud Raymond | $147,500 | First American Title Ins Co |
Source: Public Records
Mortgage History
| Date | Status | Borrower | Loan Amount |
|---|---|---|---|
| Open | Amarasinghe Kasun S | $308,750 | |
| Previous Owner | Persaud Raymond | $146,343 |
Source: Public Records
Tax History Compared to Growth
Tax History
| Year | Tax Paid | Tax Assessment Tax Assessment Total Assessment is a certain percentage of the fair market value that is determined by local assessors to be the total taxable value of land and additions on the property. | Land | Improvement |
|---|---|---|---|---|
| 2025 | $2,863 | $21,540 | $3,830 | $17,710 |
| 2024 | $2,863 | $17,580 | $4,428 | $13,152 |
| 2023 | $2,895 | $14,256 | $4,004 | $10,252 |
| 2022 | $2,745 | $19,620 | $5,460 | $14,160 |
| 2021 | $2,506 | $19,080 | $5,460 | $13,620 |
| 2020 | $2,370 | $16,440 | $5,460 | $10,980 |
| 2019 | $2,192 | $17,820 | $5,460 | $12,360 |
| 2018 | $2,124 | $11,880 | $4,640 | $7,240 |
| 2017 | $2,036 | $11,460 | $5,460 | $6,000 |
| 2016 | $1,914 | $11,123 | $4,797 | $6,326 |
| 2015 | $1,595 | $10,494 | $5,608 | $4,886 |
| 2014 | $1,595 | $9,900 | $6,060 | $3,840 |
Source: Public Records
Map
Nearby Homes
- 300A Andros Ave
- 300 Andros Ave Unit A
- 402 Grandview Ave
- 342 Union Avenue #P7
- 312 Grandview Ave
- 70 Gridley Ave
- 56 Confederation Place
- 167 Harbor Rd
- 221 South Ave
- 186 Union Ave
- 16 Union Ct
- 331 Union Ave
- 101 Lockman Ave
- 140 Union Ave
- 138 Union Ave
- 268 Bruckner Ave Unit 268
- 414 Wilcox St
- 136 Union Ave
- 256 Maple Pkwy Unit 88
- 22 Spirit Ln Unit 37
- 329 Mersereau Ave
- 327 Mersereau Ave Unit A
- 331 Mersereau Ave
- 331 Mersereau Ave Unit A
- 325 Mersereau Ave
- 329A Mersereau Ave
- 327A Mersereau Ave
- 331A Mersereau Ave
- 325A Mersereau Ave
- 323 Mersereau Ave
- 323A Mersereau Ave
- 321A Mersereau Ave
- 3 Downey Place
- 321 Mersereau Ave
- 321 Mersereau Ave Unit A
- 192A Continental Place
- 192 Continental Place
- 192 Continental Place Unit A
- 204 Continental Place