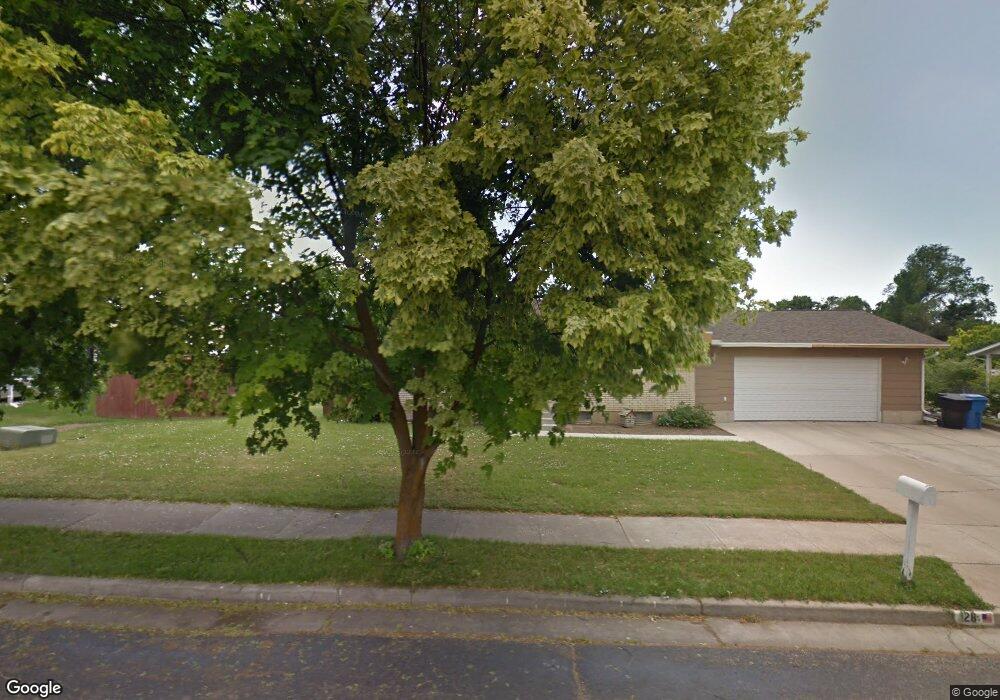
329 N 100 W Smithfield, UT 84335
Estimated Value: $317,000 - $395,000
4
Beds
2
Baths
2,042
Sq Ft
$180/Sq Ft
Est. Value
About This Home
This home is located at 329 N 100 W, Smithfield, UT 84335 and is currently estimated at $368,264, approximately $180 per square foot. 329 N 100 W is a home located in Cache County with nearby schools including Birch Creek School, North Cache Middle School, and White Pine Middle School.
Ownership History
Date
Name
Owned For
Owner Type
Purchase Details
Closed on
May 27, 2022
Sold by
Rickson Michael W and Rickson Cynthia B
Bought by
Michael W Rickson And Cynthia B Rickson Famil
Current Estimated Value
Purchase Details
Closed on
Mar 24, 2012
Sold by
Horman Todd A and Horman Travis M
Bought by
Rickson Michael W and Rickson Cindy
Home Financials for this Owner
Home Financials are based on the most recent Mortgage that was taken out on this home.
Original Mortgage
$80,000
Interest Rate
3.84%
Mortgage Type
Commercial
Create a Home Valuation Report for This Property
The Home Valuation Report is an in-depth analysis detailing your home's value as well as a comparison with similar homes in the area
Home Values in the Area
Average Home Value in this Area
Purchase History
| Date | Buyer | Sale Price | Title Company |
|---|---|---|---|
| Michael W Rickson And Cynthia B Rickson Famil | -- | None Listed On Document | |
| Rickson Michael W | -- | Northern Title Company |
Source: Public Records
Mortgage History
| Date | Status | Borrower | Loan Amount |
|---|---|---|---|
| Previous Owner | Rickson Michael W | $80,000 |
Source: Public Records
Tax History Compared to Growth
Tax History
| Year | Tax Paid | Tax Assessment Tax Assessment Total Assessment is a certain percentage of the fair market value that is determined by local assessors to be the total taxable value of land and additions on the property. | Land | Improvement |
|---|---|---|---|---|
| 2025 | $1,428 | $347,478 | $155,000 | $192,478 |
| 2024 | $1,479 | $337,616 | $155,000 | $182,616 |
| 2023 | $1,584 | $341,990 | $110,000 | $231,990 |
| 2022 | $1,610 | $341,990 | $110,000 | $231,990 |
| 2021 | $180 | $320,900 | $110,000 | $210,900 |
| 2020 | $1,174 | $195,500 | $75,000 | $120,500 |
| 2019 | $1,231 | $195,500 | $75,000 | $120,500 |
| 2018 | $931 | $142,946 | $45,000 | $97,946 |
| 2017 | $869 | $72,850 | $0 | $0 |
| 2016 | $884 | $72,850 | $0 | $0 |
| 2015 | $887 | $72,850 | $0 | $0 |
| 2014 | $870 | $72,850 | $0 | $0 |
| 2013 | -- | $72,850 | $0 | $0 |
Source: Public Records
Map
Nearby Homes