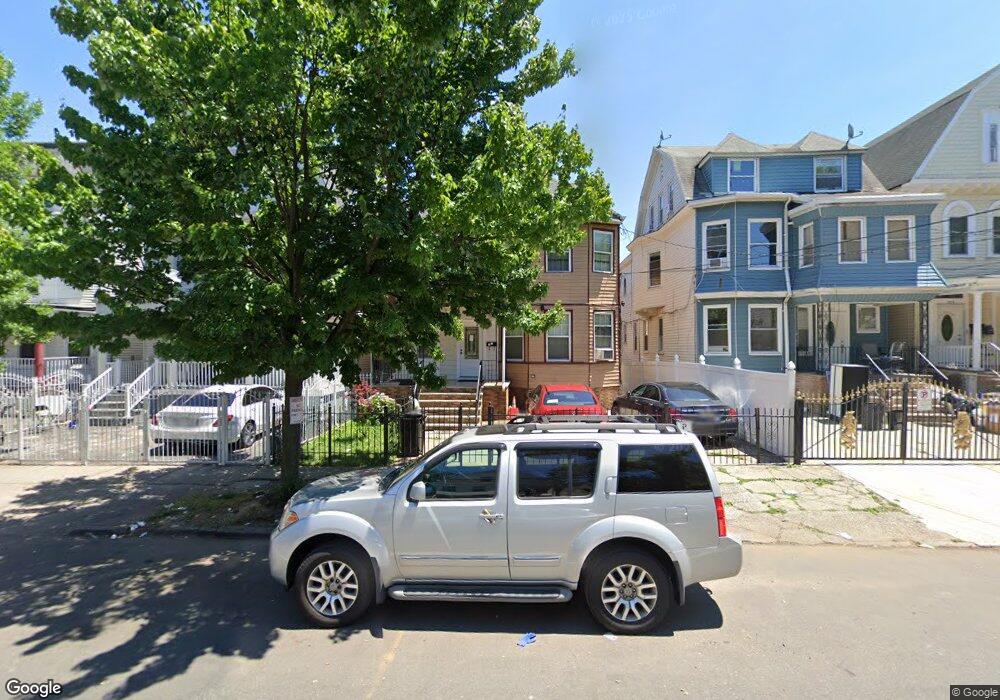
329 N 7th St Unit 331 Newark, NJ 07107
Lower Roseville NeighborhoodEstimated Value: $429,242 - $677,000
Studio
--
Bath
3,098
Sq Ft
$181/Sq Ft
Est. Value
About This Home
This home is located at 329 N 7th St Unit 331, Newark, NJ 07107 and is currently estimated at $561,311, approximately $181 per square foot. 329 N 7th St Unit 331 is a home located in Essex County with nearby schools including Dr. William H. Horton School, First Avenue Elementary School, and Franklin School.
Ownership History
Date
Name
Owned For
Owner Type
Purchase Details
Closed on
Jul 10, 2014
Sold by
Pooran Morzena and Alli Ayube
Bought by
Ali Rahim and Ali Roshan
Current Estimated Value
Purchase Details
Closed on
May 12, 2011
Sold by
Montero Maritza
Bought by
Pooran Morzena and Alli Ayube
Home Financials for this Owner
Home Financials are based on the most recent Mortgage that was taken out on this home.
Original Mortgage
$146,702
Interest Rate
4.85%
Mortgage Type
FHA
Purchase Details
Closed on
Jul 2, 2002
Sold by
Ramos Virginia
Bought by
Justiniano Juan and Montero Maritza
Home Financials for this Owner
Home Financials are based on the most recent Mortgage that was taken out on this home.
Original Mortgage
$150,927
Interest Rate
6.82%
Mortgage Type
FHA
Create a Home Valuation Report for This Property
The Home Valuation Report is an in-depth analysis detailing your home's value as well as a comparison with similar homes in the area
Home Values in the Area
Average Home Value in this Area
Purchase History
| Date | Buyer | Sale Price | Title Company |
|---|---|---|---|
| Ali Rahim | $270,000 | -- | |
| Rahim Ali | $270,000 | -- | |
| Pooran Morzena | $120,000 | Stonebridge Title Svcs Inc | |
| Justiniano Juan | $165,000 | -- |
Source: Public Records
Mortgage History
| Date | Status | Borrower | Loan Amount |
|---|---|---|---|
| Previous Owner | Pooran Morzena | $146,702 | |
| Previous Owner | Justiniano Juan | $150,927 |
Source: Public Records
Tax History
| Year | Tax Paid | Tax Assessment Tax Assessment Total Assessment is a certain percentage of the fair market value that is determined by local assessors to be the total taxable value of land and additions on the property. | Land | Improvement |
|---|---|---|---|---|
| 2025 | $4,183 | $110,000 | $30,000 | $80,000 |
| 2024 | $4,101 | $110,000 | $30,000 | $80,000 |
| 2022 | $4,110 | $110,000 | $30,000 | $80,000 |
| 2021 | $4,107 | $110,000 | $30,000 | $80,000 |
| 2020 | $4,180 | $110,000 | $30,000 | $80,000 |
| 2019 | $4,137 | $110,000 | $30,000 | $80,000 |
| 2018 | $4,062 | $110,000 | $30,000 | $80,000 |
| 2017 | $3,916 | $110,000 | $30,000 | $80,000 |
| 2016 | $3,784 | $110,000 | $30,000 | $80,000 |
| 2015 | $3,640 | $110,000 | $30,000 | $80,000 |
| 2014 | $3,411 | $110,000 | $30,000 | $80,000 |
Source: Public Records
Map
Nearby Homes
Your Personal Tour Guide
Ask me questions while you tour the home.