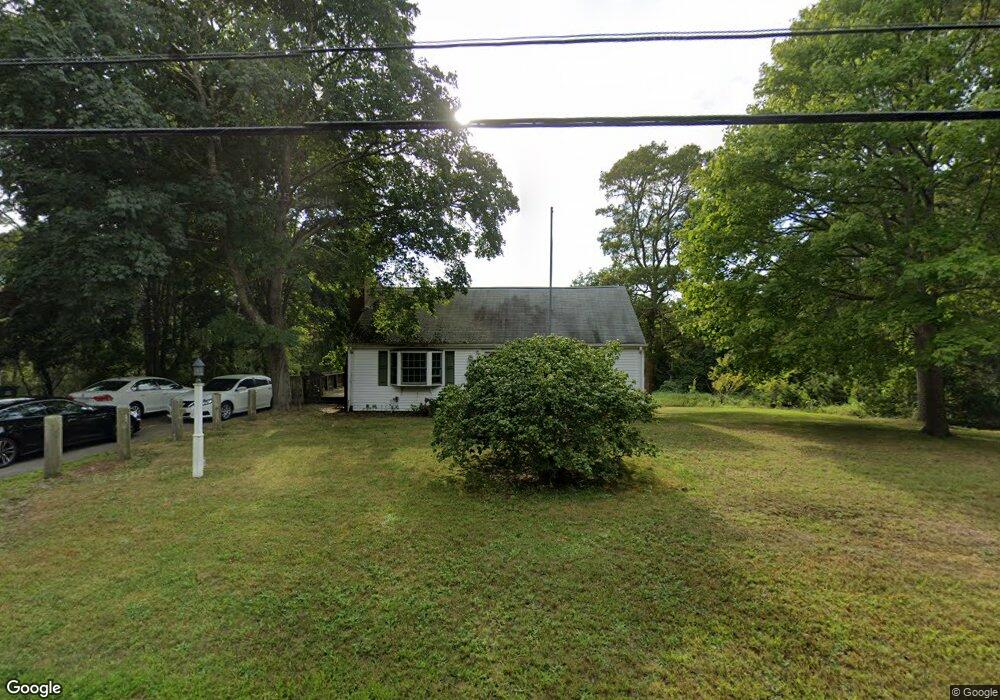
329 N Main St South Yarmouth, MA 02664
Estimated Value: $570,000 - $674,553
4
Beds
2
Baths
1,404
Sq Ft
$439/Sq Ft
Est. Value
About This Home
This home is located at 329 N Main St, South Yarmouth, MA 02664 and is currently estimated at $616,138, approximately $438 per square foot. 329 N Main St is a home located in Barnstable County with nearby schools including Dennis-Yarmouth Regional High School and St. Pius X. School.
Ownership History
Date
Name
Owned For
Owner Type
Purchase Details
Closed on
Sep 11, 2019
Sold by
Monteiro Karen
Bought by
Monteiro Karen T and Hicks Jerrica L
Current Estimated Value
Purchase Details
Closed on
Feb 16, 2016
Sold by
Homer T
Bought by
Monteiro Karen T
Home Financials for this Owner
Home Financials are based on the most recent Mortgage that was taken out on this home.
Original Mortgage
$191,250
Interest Rate
4.02%
Mortgage Type
New Conventional
Purchase Details
Closed on
Jan 9, 2015
Sold by
Homer Linda W
Bought by
Homer T
Create a Home Valuation Report for This Property
The Home Valuation Report is an in-depth analysis detailing your home's value as well as a comparison with similar homes in the area
Home Values in the Area
Average Home Value in this Area
Purchase History
| Date | Buyer | Sale Price | Title Company |
|---|---|---|---|
| Monteiro Karen T | -- | -- | |
| Monteiro Karen T | $255,000 | -- | |
| Homer T | -- | -- |
Source: Public Records
Mortgage History
| Date | Status | Borrower | Loan Amount |
|---|---|---|---|
| Previous Owner | Monteiro Karen T | $191,250 |
Source: Public Records
Tax History Compared to Growth
Tax History
| Year | Tax Paid | Tax Assessment Tax Assessment Total Assessment is a certain percentage of the fair market value that is determined by local assessors to be the total taxable value of land and additions on the property. | Land | Improvement |
|---|---|---|---|---|
| 2025 | $3,935 | $555,800 | $196,500 | $359,300 |
| 2024 | $3,642 | $493,500 | $170,900 | $322,600 |
| 2023 | $3,587 | $442,300 | $148,000 | $294,300 |
| 2022 | $3,279 | $357,200 | $134,400 | $222,800 |
| 2021 | $3,237 | $338,600 | $134,400 | $204,200 |
| 2020 | $3,143 | $314,300 | $134,400 | $179,900 |
| 2019 | $2,957 | $292,800 | $134,400 | $158,400 |
| 2018 | $6,017 | $273,000 | $114,600 | $158,400 |
| 2017 | $2,684 | $267,900 | $109,500 | $158,400 |
| 2016 | $2,580 | $258,500 | $99,600 | $158,900 |
| 2015 | $2,374 | $236,500 | $99,600 | $136,900 |
Source: Public Records
Map
Nearby Homes
- 30 Pebble Beach Way
- 91 Chipping Green Cir
- 21 Green Way
- 23 Fairwood Rd
- 140 Diane Ave
- 1 Country Club Dr
- 85 Keel Cape Dr
- 8 Viking Rock Rd
- 37 Winsome Rd
- 4 Raymond Ave
- 18 Curve Hill Rd
- 38 N Dennis Rd
- 176 Beacon St
- 116 N Main St
- 18 Turner Ln
- 29 Bass River Rd
- 7 Sunset Pines Rd
- 24 Hazelmoor Rd
- 61 Station Ave
- 321 N Main St
- 320 N Main St
- 341 N Main St
- 352 N Main St
- 345 N Main St
- 2 Peace Ln
- 8 Peace Ln
- 307 N Main St
- 4 Mid Iron Dr
- 8 Mid Iron Dr
- 1 Mid Iron Dr
- 1 Midiron Dr
- 7 Mid Iron Dr
- 17 Mid Iron Dr
- 290 N Main St
- 76 Country Club Dr
- 57 Pebble Beach Way Unit 59
- 57-59 Pebble Beach Way
- 56 Pebble Beach Way
- 56 Pepple Beach Rd