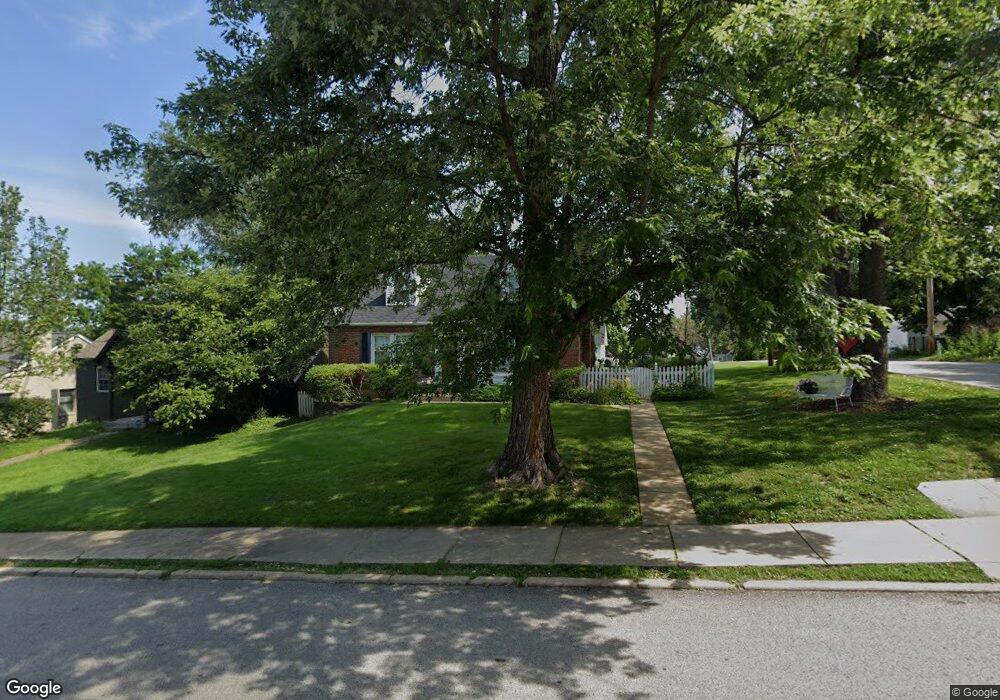
329 Newport Ave Saint Louis, MO 63119
Estimated Value: $340,000 - $423,000
2
Beds
1
Bath
1,440
Sq Ft
$264/Sq Ft
Est. Value
About This Home
This home is located at 329 Newport Ave, Saint Louis, MO 63119 and is currently estimated at $380,272, approximately $264 per square foot. 329 Newport Ave is a home located in St. Louis County with nearby schools including Avery Elementary School, Hixson Middle School, and Webster Groves High School.
Ownership History
Date
Name
Owned For
Owner Type
Purchase Details
Closed on
Apr 13, 2020
Sold by
Brady Susan A
Bought by
Brady Susan A and Susan A Bardy Living Trust
Current Estimated Value
Purchase Details
Closed on
Jun 9, 2005
Sold by
Schmitt Matthew and Schmitt Amanda
Bought by
Brady Susan A
Home Financials for this Owner
Home Financials are based on the most recent Mortgage that was taken out on this home.
Original Mortgage
$24,500
Outstanding Balance
$12,790
Interest Rate
5.76%
Mortgage Type
Credit Line Revolving
Estimated Equity
$367,482
Purchase Details
Closed on
May 31, 2002
Sold by
Carpenter Douglas W and Carpenter Christine M
Bought by
Smith Amanda
Home Financials for this Owner
Home Financials are based on the most recent Mortgage that was taken out on this home.
Original Mortgage
$185,250
Interest Rate
5.75%
Mortgage Type
Purchase Money Mortgage
Create a Home Valuation Report for This Property
The Home Valuation Report is an in-depth analysis detailing your home's value as well as a comparison with similar homes in the area
Home Values in the Area
Average Home Value in this Area
Purchase History
| Date | Buyer | Sale Price | Title Company |
|---|---|---|---|
| Brady Susan A | -- | None Available | |
| Brady Susan A | $245,000 | -- | |
| Smith Amanda | $195,000 | -- |
Source: Public Records
Mortgage History
| Date | Status | Borrower | Loan Amount |
|---|---|---|---|
| Open | Brady Susan A | $24,500 | |
| Open | Brady Susan A | $196,000 | |
| Previous Owner | Smith Amanda | $185,250 |
Source: Public Records
Tax History Compared to Growth
Tax History
| Year | Tax Paid | Tax Assessment Tax Assessment Total Assessment is a certain percentage of the fair market value that is determined by local assessors to be the total taxable value of land and additions on the property. | Land | Improvement |
|---|---|---|---|---|
| 2025 | $3,887 | $60,170 | $44,100 | $16,070 |
| 2024 | $3,887 | $55,670 | $32,070 | $23,600 |
| 2023 | $3,869 | $55,670 | $32,070 | $23,600 |
| 2022 | $3,946 | $52,760 | $32,070 | $20,690 |
| 2021 | $3,933 | $52,760 | $32,070 | $20,690 |
| 2020 | $3,794 | $47,400 | $32,070 | $15,330 |
| 2019 | $3,767 | $47,400 | $32,070 | $15,330 |
| 2018 | $3,780 | $42,240 | $22,460 | $19,780 |
| 2017 | $3,754 | $42,240 | $22,460 | $19,780 |
| 2016 | $3,633 | $39,140 | $19,250 | $19,890 |
| 2015 | $3,646 | $39,140 | $19,250 | $19,890 |
| 2014 | $3,371 | $35,190 | $14,540 | $20,650 |
Source: Public Records
Map
Nearby Homes
- 112 Oakwood Ave
- 441 Park Rd
- 546 Holland Ave
- 610 Cornelia Ave
- 814 Holland Ave
- 617 N Elm Ave
- 827 Cornell Ave
- 619 N Bompart Ave
- 400 Marion Ave
- 218 Euclid Ave
- 136 N Gore Ave
- 716 Clark Ave
- 1013 Bell Ave
- 450 E Lockwood Ave Unit 303
- 901 Ennis Ave
- 544 Summit Ave
- 2911 Brazeau Ave
- 808 Greeley Ave
- 8908 W Pendleton Ave
- 2904 Collier Ave
- 325 Newport Ave
- 321 Newport Ave
- 515 Lafayette Ave
- 501 Glen Rd
- 317 Newport Ave
- 511 Glen Rd
- 328 Newport Ave
- 332 Newport Ave
- 324 Newport Ave
- 521 Lafayette Ave
- 336 Newport Ave
- 313 Newport Ave
- 320 Newport Ave
- 515 Glen Rd
- 340 Newport Ave
- 316 Newport Ave
- 304 Fairview Ave
- 309 Newport Ave
- 15 Marvin Ct
- 312 Newport Ave