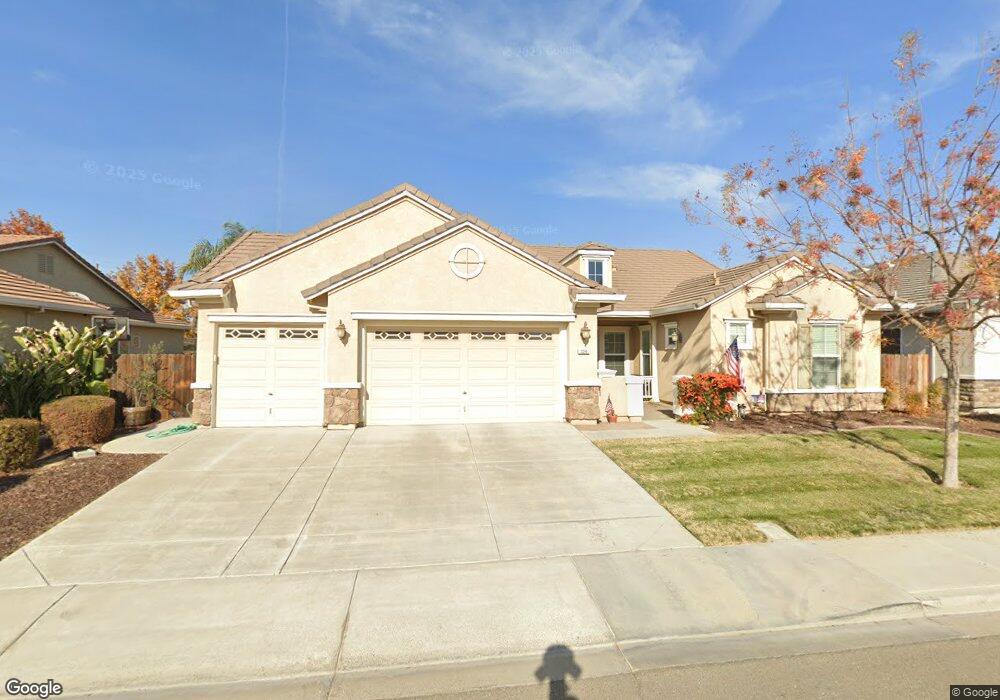
329 Northampton Way Newman, CA 95360
Estimated Value: $455,449 - $513,000
3
Beds
2
Baths
2,091
Sq Ft
$235/Sq Ft
Est. Value
About This Home
This home is located at 329 Northampton Way, Newman, CA 95360 and is currently estimated at $492,362, approximately $235 per square foot. 329 Northampton Way is a home located in Stanislaus County with nearby schools including Orestimba High School.
Ownership History
Date
Name
Owned For
Owner Type
Purchase Details
Closed on
Feb 15, 2022
Sold by
Arnett Donald R and Arnett Ann Bernice
Bought by
Donald R Arnett And Bernice A Arnett 2022 Tru and Arnett Bernice A
Current Estimated Value
Purchase Details
Closed on
Oct 26, 2008
Sold by
Federal Home Loan Mortgage Corporation
Bought by
Arnett Donald R and Arnett Bernice Ann
Purchase Details
Closed on
Jul 2, 2008
Sold by
Aguilera Salvador
Bought by
Federal Home Loan Mortgage Corporation
Purchase Details
Closed on
Feb 24, 2006
Sold by
Scm Sierra Creek Llc
Bought by
Aguilera Salvador
Home Financials for this Owner
Home Financials are based on the most recent Mortgage that was taken out on this home.
Original Mortgage
$354,484
Interest Rate
5.75%
Mortgage Type
Purchase Money Mortgage
Create a Home Valuation Report for This Property
The Home Valuation Report is an in-depth analysis detailing your home's value as well as a comparison with similar homes in the area
Home Values in the Area
Average Home Value in this Area
Purchase History
| Date | Buyer | Sale Price | Title Company |
|---|---|---|---|
| Donald R Arnett And Bernice A Arnett 2022 Tru | -- | None Listed On Document | |
| Arnett Donald R | $178,500 | None Available | |
| Federal Home Loan Mortgage Corporation | $189,603 | Accommodation | |
| Aguilera Salvador | $443,500 | Chicago Title Company |
Source: Public Records
Mortgage History
| Date | Status | Borrower | Loan Amount |
|---|---|---|---|
| Previous Owner | Aguilera Salvador | $354,484 |
Source: Public Records
Tax History Compared to Growth
Tax History
| Year | Tax Paid | Tax Assessment Tax Assessment Total Assessment is a certain percentage of the fair market value that is determined by local assessors to be the total taxable value of land and additions on the property. | Land | Improvement |
|---|---|---|---|---|
| 2025 | $3,055 | $229,850 | $64,380 | $165,470 |
| 2024 | $2,978 | $225,344 | $63,118 | $162,226 |
| 2023 | $2,898 | $220,927 | $61,881 | $159,046 |
| 2022 | $2,841 | $216,596 | $60,668 | $155,928 |
| 2021 | $2,786 | $212,350 | $59,479 | $152,871 |
| 2020 | $2,733 | $210,174 | $58,870 | $151,304 |
| 2019 | $2,737 | $206,054 | $57,716 | $148,338 |
| 2018 | $2,565 | $202,015 | $56,585 | $145,430 |
| 2017 | $2,759 | $198,055 | $55,476 | $142,579 |
| 2016 | $2,464 | $194,173 | $54,389 | $139,784 |
| 2015 | $2,529 | $191,258 | $53,573 | $137,685 |
| 2014 | $2,505 | $187,512 | $52,524 | $134,988 |
Source: Public Records
Map
Nearby Homes
- 432 Red Lion Way
- 832 Castellona Dr
- 918 Castellona Dr
- 345 Cinnamon Teal Way
- 1166 Labrador Ct
- 1115 Pintail Ct
- 507 Lady Slipper Ln
- 627 Bunting Ln
- 622 Crevison Peak Dr
- 1328 Basil Ct
- 501 Flour Mill Dr
- 1335 Eucalyptus Ave
- 0 E Stuhr Rd
- 1506 Lochbrea Place
- 759 Hagerman Peak Dr
- 1059 P St
- 741 Real Ave
- 1939 L St
- 1059 Q St
- 1122 Fresno St
- 325 Northampton Way
- 333 Northampton Way
- 321 Northampton Way
- 337 Northampton Way
- 328 Northampton Way
- 324 Northampton Way
- 332 Northampton Way
- 320 Northampton Way Unit 3
- 317 Northampton Way
- 336 Northampton Way
- 315 Tower Way
- 319 Tower Way
- 314 Northampton Way
- 311 Tower Way
- 313 Northampton Way
- 403 Northampton Way
- 323 Tower Way
- 307 Tower Way
- 711 Southington Way
- 308 Northampton Way