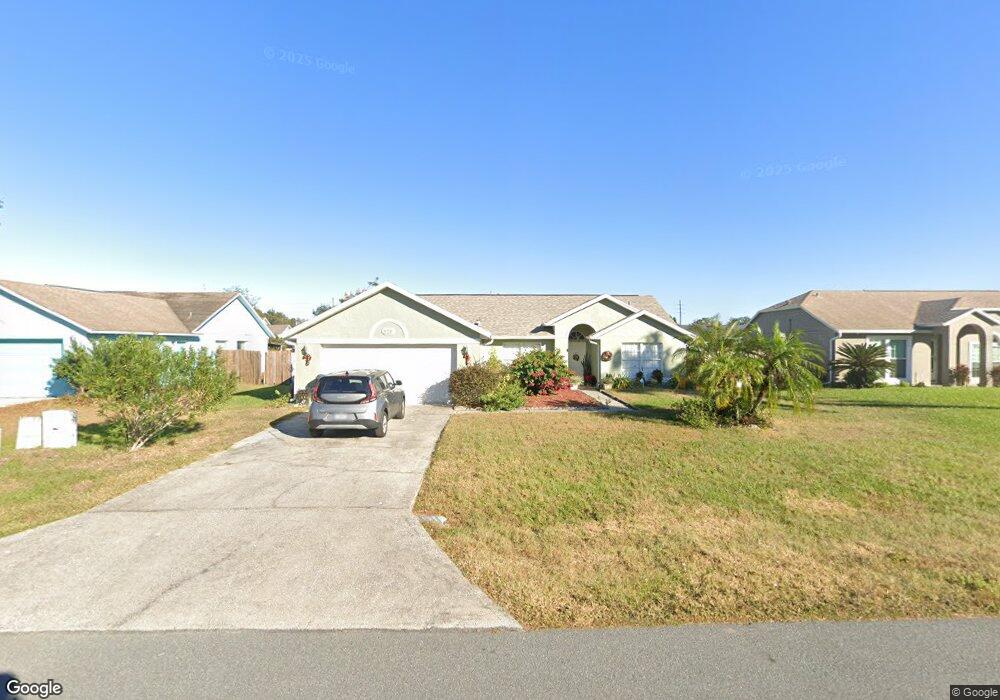
329 Robbins Rest Cir Davenport, FL 33896
Estimated Value: $260,000 - $323,000
3
Beds
2
Baths
1,377
Sq Ft
$213/Sq Ft
Est. Value
About This Home
This home is located at 329 Robbins Rest Cir, Davenport, FL 33896 and is currently estimated at $292,651, approximately $212 per square foot. 329 Robbins Rest Cir is a home located in Polk County with nearby schools including Davenport School Of The Arts, Loughman Oaks Elementary School, and Dundee Elementary Academy.
Ownership History
Date
Name
Owned For
Owner Type
Purchase Details
Closed on
Apr 20, 2015
Sold by
Fannie Mae
Bought by
Marquez Estella
Current Estimated Value
Home Financials for this Owner
Home Financials are based on the most recent Mortgage that was taken out on this home.
Original Mortgage
$187,350
Outstanding Balance
$144,904
Interest Rate
3.87%
Mortgage Type
Reverse Mortgage Home Equity Conversion Mortgage
Estimated Equity
$147,747
Purchase Details
Closed on
Sep 5, 2014
Sold by
Junecko Robert Samuel
Bought by
Federal National Mortgage Association
Purchase Details
Closed on
Mar 18, 2014
Sold by
Junecko Mary Ann A
Bought by
Robbins Rest Homeowners Association Inco
Purchase Details
Closed on
Sep 20, 2001
Sold by
Bush Robert L and Bush A
Bought by
Junecko Robert S and Junecko Mary A
Home Financials for this Owner
Home Financials are based on the most recent Mortgage that was taken out on this home.
Original Mortgage
$91,250
Interest Rate
6.97%
Mortgage Type
New Conventional
Create a Home Valuation Report for This Property
The Home Valuation Report is an in-depth analysis detailing your home's value as well as a comparison with similar homes in the area
Home Values in the Area
Average Home Value in this Area
Purchase History
| Date | Buyer | Sale Price | Title Company |
|---|---|---|---|
| Marquez Estella | $124,900 | Reo Title Company Of Fl Llc | |
| Federal National Mortgage Association | $64,100 | None Available | |
| Robbins Rest Homeowners Association Inco | $2,600 | None Available | |
| Junecko Robert S | $101,400 | -- |
Source: Public Records
Mortgage History
| Date | Status | Borrower | Loan Amount |
|---|---|---|---|
| Open | Marquez Estella | $187,350 | |
| Previous Owner | Junecko Robert S | $91,250 |
Source: Public Records
Tax History Compared to Growth
Tax History
| Year | Tax Paid | Tax Assessment Tax Assessment Total Assessment is a certain percentage of the fair market value that is determined by local assessors to be the total taxable value of land and additions on the property. | Land | Improvement |
|---|---|---|---|---|
| 2025 | $1,243 | $174,700 | -- | -- |
| 2024 | $2,116 | $169,776 | -- | -- |
| 2023 | $2,116 | $164,831 | $0 | $0 |
| 2022 | $2,044 | $160,030 | $0 | $0 |
| 2021 | $2,054 | $155,369 | $18,000 | $137,369 |
| 2020 | $2,271 | $152,008 | $17,000 | $135,008 |
| 2018 | $1,943 | $121,084 | $16,000 | $105,084 |
| 2017 | $1,655 | $88,064 | $0 | $0 |
| 2016 | $1,557 | $81,737 | $0 | $0 |
| 2015 | $1,167 | $76,990 | $0 | $0 |
| 2014 | $526 | $39,901 | $0 | $0 |
Source: Public Records
Map
Nearby Homes
- 307 Balmoral Ct
- 407 Darlington Loop
- 222 Darlington Loop
- 196 Villa Domani Ct
- 172 Villa Domani Ct
- 204 Villa Domani Cir
- 175 Villa Domani Cir
- 212 Villa Domani Cir
- 205 Villa Domani Cir Unit 62
- 143 Hollingshead Loop
- 324 Pine Lake View Dr
- 100 Sunridge Woods Ct
- 236 Villa Domani Cir
- 235 Villa Domani Cir
- 316 Villa Domani Ct
- 235 Hollingshead Loop
- 245 Hollingshead Loop
- 470 Lake Shore Pkwy
- 486 Lake Shore Pkwy
- 341 Whittier St
- 323 Robbins Rest Cir
- 335 Robbins Rest Cir
- 134 Robbins Rest Place
- 341 Robbins Rest Cir
- 317 Robbins Rest Cir
- 239 Robbins Rest Cir
- 330 Robbins Rest Cir
- 324 Robbins Rest Cir
- 336 Robbins Rest Cir
- 318 Robbins Rest Cir
- 233 Robbins Rest Cir
- 347 Robbins Rest Cir
- 128 Robbins Rest Ct
- 342 Robbins Rest Cir
- 127 Robbins Rest Ct
- 312 Robbins Rest Cir
- 407 Robbins Rest Cir
- 227 Robbins Rest Cir
- 348 Robbins Rest Cir
- 252 Robbins Rest Cir