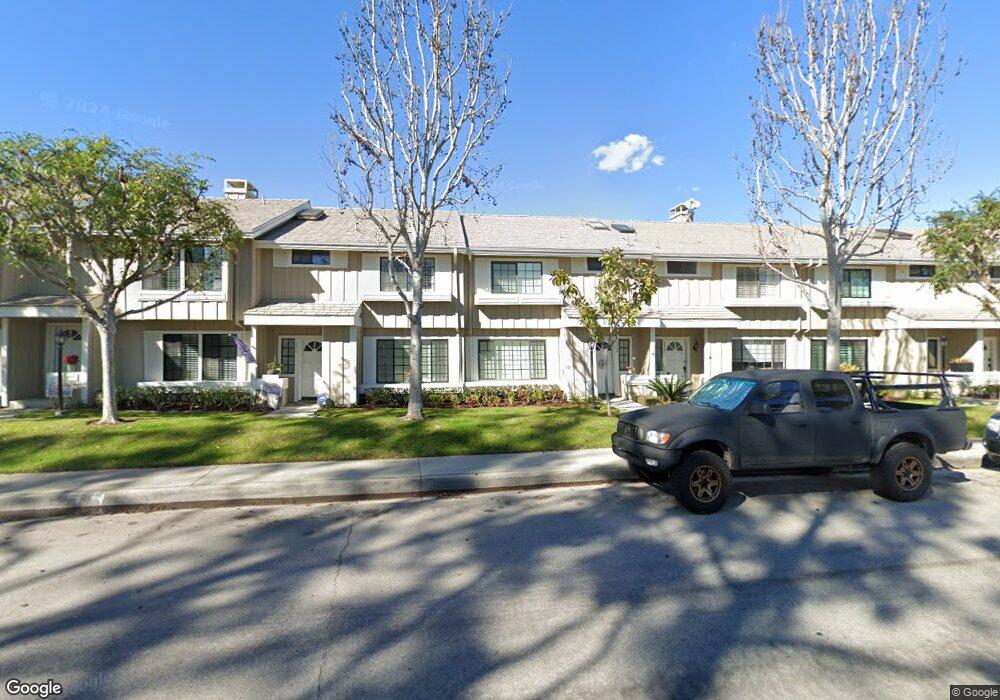
329 Spinnaker Way Seal Beach, CA 90740
Estimated Value: $1,325,000 - $1,814,000
2
Beds
3
Baths
1,428
Sq Ft
$1,044/Sq Ft
Est. Value
About This Home
This home is located at 329 Spinnaker Way, Seal Beach, CA 90740 and is currently estimated at $1,490,596, approximately $1,043 per square foot. 329 Spinnaker Way is a home located in Orange County with nearby schools including J. H. Mcgaugh Elementary School, Jack L. Weaver Elementary School, and Sharon Christa Mcauliffe Middle School.
Ownership History
Date
Name
Owned For
Owner Type
Purchase Details
Closed on
Apr 28, 2017
Sold by
Chen Theodore Tienku
Bought by
Chen Nancy Suling and Spinnaker Irrevocable Trust
Current Estimated Value
Purchase Details
Closed on
Dec 18, 2013
Sold by
Lin Chung Fong
Bought by
Chen Theodore Tienku and Theodore Tienku Chen Revocable Trust
Home Financials for this Owner
Home Financials are based on the most recent Mortgage that was taken out on this home.
Original Mortgage
$400,000
Outstanding Balance
$108,761
Interest Rate
4.13%
Mortgage Type
New Conventional
Estimated Equity
$1,381,835
Purchase Details
Closed on
Dec 5, 2008
Sold by
Shu Chung Fong
Bought by
Lin Chung Fong and Chung Fong Lin 1998 Revocable Trust
Purchase Details
Closed on
May 11, 1999
Sold by
Joyce Andrew M and Joyce Irene
Bought by
Shu Chung Fong and Chung Fong Shu 1998 Revocable Trust
Purchase Details
Closed on
Oct 27, 1993
Sold by
Joyce Andrew M and Joyce Irene
Bought by
Joyce Andrew M and Joyce Irene
Create a Home Valuation Report for This Property
The Home Valuation Report is an in-depth analysis detailing your home's value as well as a comparison with similar homes in the area
Home Values in the Area
Average Home Value in this Area
Purchase History
| Date | Buyer | Sale Price | Title Company |
|---|---|---|---|
| Chen Nancy Suling | -- | None Available | |
| Chen Theodore Tienku | $606,500 | Chicago Title Company | |
| Lin Chung Fong | -- | None Available | |
| Shu Chung Fong | $336,000 | North American Title Co | |
| Joyce Andrew M | -- | -- |
Source: Public Records
Mortgage History
| Date | Status | Borrower | Loan Amount |
|---|---|---|---|
| Open | Chen Theodore Tienku | $400,000 |
Source: Public Records
Tax History
| Year | Tax Paid | Tax Assessment Tax Assessment Total Assessment is a certain percentage of the fair market value that is determined by local assessors to be the total taxable value of land and additions on the property. | Land | Improvement |
|---|---|---|---|---|
| 2025 | $8,640 | $743,480 | $599,845 | $143,635 |
| 2024 | $8,640 | $728,902 | $588,083 | $140,819 |
| 2023 | $8,443 | $714,610 | $576,552 | $138,058 |
| 2022 | $8,350 | $700,599 | $565,248 | $135,351 |
| 2021 | $8,163 | $686,862 | $554,164 | $132,698 |
| 2020 | $8,171 | $679,820 | $548,482 | $131,338 |
| 2019 | $7,920 | $666,491 | $537,728 | $128,763 |
| 2018 | $7,559 | $653,423 | $527,184 | $126,239 |
| 2017 | $7,398 | $640,611 | $516,847 | $123,764 |
| 2016 | $7,256 | $628,050 | $506,712 | $121,338 |
| 2015 | $7,162 | $618,617 | $499,101 | $119,516 |
| 2014 | $7,063 | $606,500 | $489,325 | $117,175 |
Source: Public Records
Map
Nearby Homes
- 328 Regatta Way
- 315 Spinnaker Way
- 79 Riversea Rd
- 85 Riversea Rd
- 48 Riversea Rd
- 208 Ocean Place
- 100 Electric Ave
- 10 Ocean Place
- 7019 E Seaside Walk
- 6911 E Ocean Blvd
- 320 7th St
- 6810 E Ocean Blvd
- 236 8th St
- 900 Catalina Ave
- 6600 E Ocean Blvd
- 6514 E Ocean Blvd
- 10 66th Place
- 27 66th Place
- 11 Vista Del Golfo
- 5959 E Naples Plaza Unit 306
- 327 Spinnaker Way
- 331 Spinnaker Way
- 325 Spinnaker Way
- 333 Spinnaker Way
- 335 Spinnaker Way
- 323 Spinnaker Way
- 337 Spinnaker Way
- 321 Spinnaker Way
- 334 Spinnaker Way
- 332 Spinnaker Way
- 319 Spinnaker Way
- 330 Spinnaker Way
- 336 Spinnaker Way
- 324 Regatta Way
- 330 Regatta Way
- 338 Spinnaker Way
- 328 Spinnaker Way
- 332 Regatta Way
- 317 Spinnaker Way
- 340 Spinnaker Way
Your Personal Tour Guide
Ask me questions while you tour the home.