
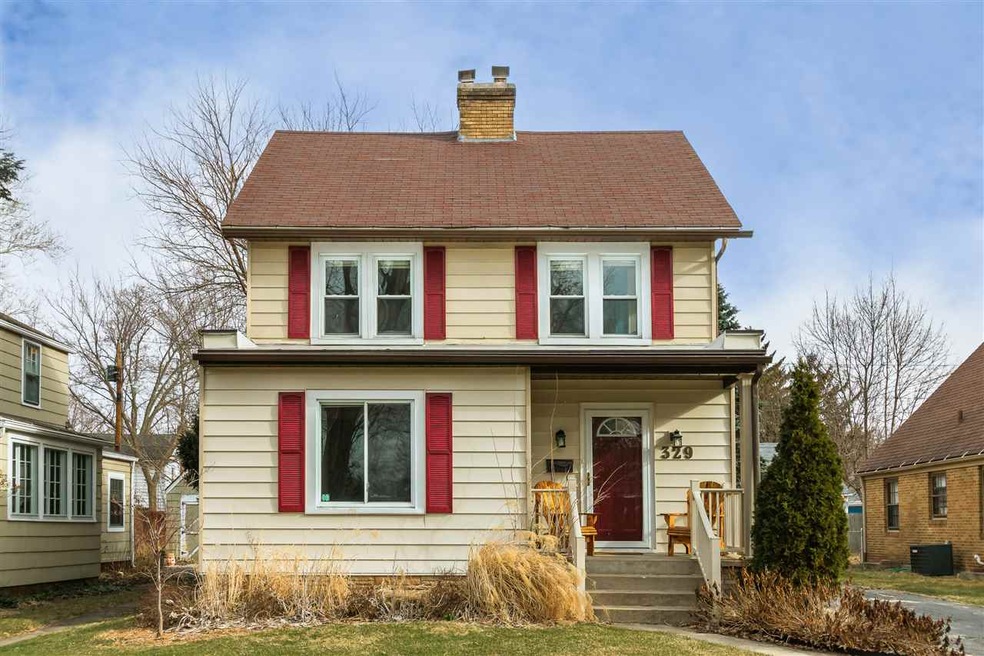
329 Wakewa Ave South Bend, IN 46617
North Shore Triangle Neighborhood
3
Beds
2
Baths
1,784
Sq Ft
5,750
Sq Ft Lot
Highlights
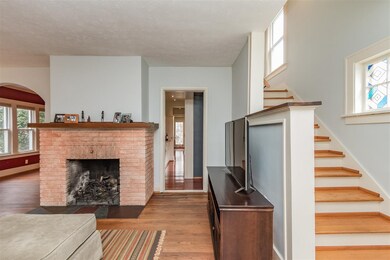
- Living Room with Fireplace
- Formal Dining Room
- Chair Railings
- Wood Flooring
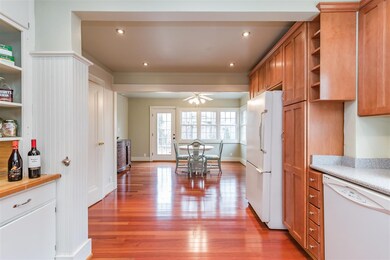
- Eat-In Kitchen
- 3-minute walk to Parkovash Park
About This Home
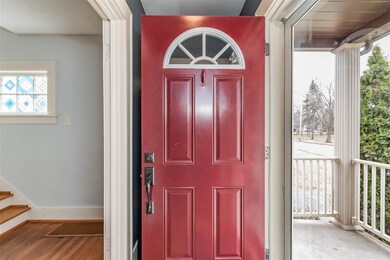
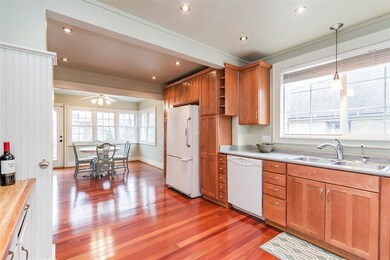
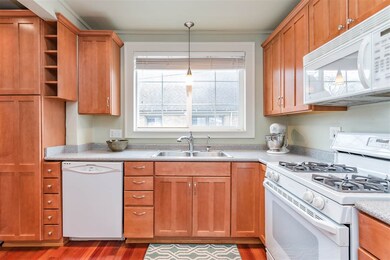
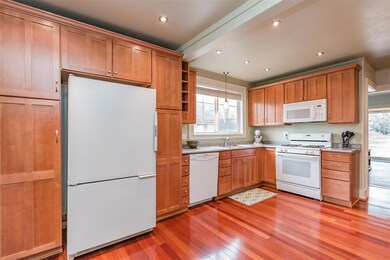
As of July 2022Walk to ND, DTSB, or the riverwalk from this entirely renovated home in North Shore Triangle directly across from a lovely city park! Quality, tasteful updates throughout include a new kitchen with gorgeous cherry hardwood floors, high-end cabinetry, and a new main level bath with granite counters and tile flooring. Other updates include newer windows, paint, and lighting. Hardwood flooring is throughout the rest of the home. The laundry can be on the main level or in the basement, which is very clean and dry. The exterior of the home is entirely maintenance-free and has newer landscaping. The backyard is fenced and private with a concrete pad for future garage.Taxes with taxes homestead and mortgage exemptions will be $1,329.00.
Home Details
Home Type
- Single Family
Est. Annual Taxes
- $2,828
Year Built
- Built in 1925
Lot Details
- 5,750 Sq Ft Lot
- Lot Dimensions are 48 x 120
- Level Lot
Home Design
- Asphalt Roof
Interior Spaces
- 2-Story Property
- Chair Railings
- Crown Molding
- Wood Burning Fireplace
- Living Room with Fireplace
- Formal Dining Room
Kitchen
- Eat-In Kitchen
- Disposal
Flooring
- Wood
- Vinyl
Bedrooms and Bathrooms
- 3 Bedrooms
- Bathtub With Separate Shower Stall
Unfinished Basement
- Block Basement Construction
- 1 Bedroom in Basement
Location
- Suburban Location
Utilities
- Forced Air Heating and Cooling System
- Heating System Uses Gas
Listing and Financial Details
- Assessor Parcel Number 71-08-02-234-022.000-026
Ownership History
Date
Name
Owned For
Owner Type
Purchase Details
Listed on
Jun 13, 2022
Closed on
Jul 22, 2022
Sold by
Taylor Barnes Ashley and Taylor Ryan M
Bought by
Loughran Deborah M
Seller's Agent
Tim Murray
Coldwell Banker Real Estate Group
Buyer's Agent
Robert Shannon
Cressy & Everett - South Bend
List Price
$249,900
Sold Price
$243,000
Premium/Discount to List
-$6,900
-2.76%
Total Days on Market
2
Current Estimated Value
Home Financials for this Owner
Home Financials are based on the most recent Mortgage that was taken out on this home.
Estimated Appreciation
$53,006
Avg. Annual Appreciation
7.17%
Original Mortgage
$218,700
Outstanding Balance
$210,907
Interest Rate
5.81%
Mortgage Type
New Conventional
Estimated Equity
$85,099
Purchase Details
Closed on
May 28, 2019
Sold by
Taylor Barnes Ashley
Bought by
Barnes Ashley Taylor and Petersen Ryan M
Purchase Details
Listed on
Mar 7, 2016
Closed on
May 23, 2016
Sold by
Atkinson Lonnie Ray and Sapra Sonalini
Bought by
Barnes Ashley Taylor
Seller's Agent
Julia Robbins
RE/MAX 100
Buyer's Agent
Tim Murray
Coldwell Banker Real Estate Group
List Price
$146,900
Sold Price
$150,500
Premium/Discount to List
$3,600
2.45%
Home Financials for this Owner
Home Financials are based on the most recent Mortgage that was taken out on this home.
Avg. Annual Appreciation
7.80%
Original Mortgage
$100,500
Interest Rate
3.66%
Mortgage Type
New Conventional
Purchase Details
Listed on
Mar 27, 2015
Closed on
Apr 28, 2015
Sold by
Smith Christian
Bought by
Atkinson Lonnie Ray and Sapra Sonalini
Seller's Agent
Julia Robbins
RE/MAX 100
Buyer's Agent
Julia Robbins
RE/MAX 100
List Price
$139,900
Sold Price
$135,900
Premium/Discount to List
-$4,000
-2.86%
Home Financials for this Owner
Home Financials are based on the most recent Mortgage that was taken out on this home.
Avg. Annual Appreciation
9.91%
Purchase Details
Listed on
Sep 11, 2013
Closed on
Oct 15, 2013
Sold by
Leslie James P
Bought by
Smith Christian
Seller's Agent
Julia Robbins
RE/MAX 100
Buyer's Agent
Julia Robbins
RE/MAX 100
List Price
$149,900
Sold Price
$134,500
Premium/Discount to List
-$15,400
-10.27%
Home Financials for this Owner
Home Financials are based on the most recent Mortgage that was taken out on this home.
Avg. Annual Appreciation
0.68%
Map
Create a Home Valuation Report for This Property
The Home Valuation Report is an in-depth analysis detailing your home's value as well as a comparison with similar homes in the area
Similar Homes in South Bend, IN
Home Values in the Area
Average Home Value in this Area
Purchase History
| Date | Type | Sale Price | Title Company |
|---|---|---|---|
| Warranty Deed | -- | Metropolitan Title | |
| Warranty Deed | -- | Metropolitan Title | |
| Warranty Deed | -- | -- | |
| Warranty Deed | -- | Metropolitan Title | |
| Warranty Deed | -- | Meridian Title |
Source: Public Records
Mortgage History
| Date | Status | Loan Amount | Loan Type |
|---|---|---|---|
| Open | $218,700 | New Conventional | |
| Previous Owner | $100,500 | New Conventional | |
| Previous Owner | $101,250 | New Conventional | |
| Previous Owner | $22,945 | Future Advance Clause Open End Mortgage |
Source: Public Records
Property History
| Date | Event | Price | Change | Sq Ft Price |
|---|---|---|---|---|
| 07/25/2022 07/25/22 | Sold | $243,000 | -2.8% | $136 / Sq Ft |
| 06/19/2022 06/19/22 | Pending | -- | -- | -- |
| 06/13/2022 06/13/22 | For Sale | $249,900 | +66.0% | $140 / Sq Ft |
| 05/27/2016 05/27/16 | Sold | $150,500 | +2.5% | $84 / Sq Ft |
| 03/09/2016 03/09/16 | Pending | -- | -- | -- |
| 03/07/2016 03/07/16 | For Sale | $146,900 | +8.1% | $82 / Sq Ft |
| 04/28/2015 04/28/15 | Sold | $135,900 | -2.9% | $76 / Sq Ft |
| 03/29/2015 03/29/15 | Pending | -- | -- | -- |
| 03/27/2015 03/27/15 | For Sale | $139,900 | +4.0% | $78 / Sq Ft |
| 10/21/2013 10/21/13 | Sold | $134,500 | -10.3% | $75 / Sq Ft |
| 10/04/2013 10/04/13 | Pending | -- | -- | -- |
| 09/11/2013 09/11/13 | For Sale | $149,900 | -- | $84 / Sq Ft |
Source: Indiana Regional MLS
Tax History
| Year | Tax Paid | Tax Assessment Tax Assessment Total Assessment is a certain percentage of the fair market value that is determined by local assessors to be the total taxable value of land and additions on the property. | Land | Improvement |
|---|---|---|---|---|
| 2024 | $6,198 | $295,900 | $20,500 | $275,400 |
| 2023 | $6,155 | $258,200 | $20,500 | $237,700 |
| 2022 | $2,369 | $198,300 | $20,500 | $177,800 |
| 2021 | $2,141 | $176,700 | $29,100 | $147,600 |
| 2020 | $2,043 | $169,000 | $27,800 | $141,200 |
| 2019 | $1,570 | $152,700 | $25,100 | $127,600 |
| 2018 | $1,652 | $138,500 | $22,900 | $115,600 |
| 2017 | $1,673 | $135,500 | $22,900 | $112,600 |
| 2016 | $1,352 | $108,400 | $18,300 | $90,100 |
| 2014 | $2,828 | $108,000 | $18,300 | $89,700 |
| 2013 | $2,288 | $87,200 | $15,800 | $71,400 |
Source: Public Records
Source: Indiana Regional MLS
MLS Number: 201609134
APN: 71-08-02-234-022.000-026
Disclaimer: Certain information contained herein is derived from information provided by parties other than Homes.com. All information provided is deemed reliable, but is not guaranteed to be accurate and should be independently verified.
![]() IDX information is provided exclusively for personal, non-commercial use, and may not be used for any purpose other than to identify prospective properties consumers may be interested in purchasing. Information is deemed reliable but not guaranteed.
IDX information is provided exclusively for personal, non-commercial use, and may not be used for any purpose other than to identify prospective properties consumers may be interested in purchasing. Information is deemed reliable but not guaranteed.
Nearby Homes
- 209 Marquette Ave
- 405 Parkovash Ave
- 214 Tonti St
- 134 Wakewa Ave
- 212 Marquette Ave
- 208 Tonti St
- 1230 Hillcrest Rd
- 113 W North Shore Dr
- 1026 N Michigan St
- 1025 Riverside Dr
- 836 Dushane Ct
- 615 Marquette Ave
- 627 Ostemo Place
- 1208 Leeper Ave
- 602 W Angela Blvd
- 817 Leland Ave
- 122 E North Shore Dr
- 1069 Riverside Dr
- 1009 N Niles Ave
- 739 Leland Ave