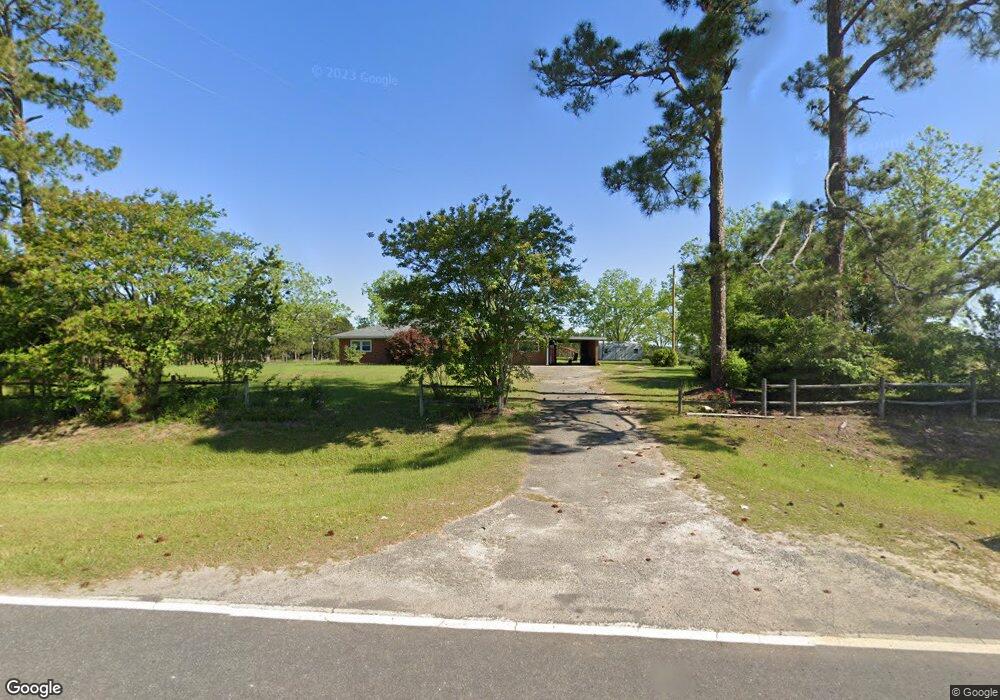
3291 Denham Rd Sycamore, GA 31790
Estimated Value: $184,000 - $212,194
3
Beds
2
Baths
1,809
Sq Ft
$108/Sq Ft
Est. Value
About This Home
This home is located at 3291 Denham Rd, Sycamore, GA 31790 and is currently estimated at $194,731, approximately $107 per square foot. 3291 Denham Rd is a home located in Turner County with nearby schools including Turner County Elementary School, Turner County Middle School, and Turner County High School.
Ownership History
Date
Name
Owned For
Owner Type
Purchase Details
Closed on
Aug 29, 2024
Sold by
Pavlina Zollie Donahoo Trust
Bought by
Headrick Jordan Nicole and Ray Dylan Anthony
Current Estimated Value
Home Financials for this Owner
Home Financials are based on the most recent Mortgage that was taken out on this home.
Original Mortgage
$154,900
Outstanding Balance
$144,886
Interest Rate
5.99%
Mortgage Type
New Conventional
Estimated Equity
$49,845
Purchase Details
Closed on
Apr 27, 2001
Sold by
Pavlina-Kenny Leah M
Bought by
Pavlina Zollie Trust
Purchase Details
Closed on
Apr 9, 1999
Sold by
Kenny Thomas Martin
Bought by
Pavlina Leah Marie
Purchase Details
Closed on
Sep 10, 1998
Sold by
Pvalina Leah M and Pvalina Tho
Bought by
Donahoo Carolyn
Purchase Details
Closed on
Jul 27, 1998
Sold by
Donahoo Carolyn
Bought by
Pvalina Leah M and Pvalina Tho
Create a Home Valuation Report for This Property
The Home Valuation Report is an in-depth analysis detailing your home's value as well as a comparison with similar homes in the area
Home Values in the Area
Average Home Value in this Area
Purchase History
| Date | Buyer | Sale Price | Title Company |
|---|---|---|---|
| Headrick Jordan Nicole | $164,900 | -- | |
| Pavlina Zollie Trust | -- | -- | |
| Pavlina Leah Marie | -- | -- | |
| Donahoo Carolyn | -- | -- | |
| Pvalina Leah M | $75,000 | -- |
Source: Public Records
Mortgage History
| Date | Status | Borrower | Loan Amount |
|---|---|---|---|
| Open | Headrick Jordan Nicole | $154,900 |
Source: Public Records
Tax History
| Year | Tax Paid | Tax Assessment Tax Assessment Total Assessment is a certain percentage of the fair market value that is determined by local assessors to be the total taxable value of land and additions on the property. | Land | Improvement |
|---|---|---|---|---|
| 2025 | $524 | $21,062 | $21,062 | $0 |
| 2024 | $1,826 | $81,796 | $21,062 | $60,734 |
| 2023 | $1,408 | $55,580 | $19,152 | $36,428 |
| 2022 | $1,403 | $55,580 | $19,152 | $36,428 |
| 2021 | $1,398 | $55,580 | $19,152 | $36,428 |
| 2020 | $1,394 | $55,580 | $19,152 | $36,428 |
| 2019 | $1,390 | $55,580 | $19,152 | $36,428 |
| 2018 | $1,778 | $55,580 | $19,152 | $36,428 |
| 2017 | $1,778 | $55,580 | $19,152 | $36,428 |
| 2016 | $1,378 | $55,580 | $19,152 | $36,428 |
| 2015 | -- | $55,580 | $2,128 | $36,428 |
| 2014 | -- | $55,580 | $19,152 | $36,428 |
Source: Public Records
Map
Nearby Homes
- 1511 Bussey Rd
- 1441 Bussey Rd
- 320 S Mattie Ave
- 2633 US Hwy 41
- 196 N Mattie Ave
- 196 N Mattie Ave Unit 9-10-11
- 41 W Collins St
- 883 N Railroad Ave
- 240 Whittle Cir
- 1801 Georgia 107
- Randall Whiddon Dr
- Randall Whiddon Dr
- Randall Whiddon Dr
- Randall Whiddon Dr Unit LotWP001
- 411 Haley Ave
- 0 E Washington Ave
- 0 E Monroe Ave
- 616 E Washington Ave
- 0 Story St
- 233 Martin Luther King Junior Dr
- 3200 Denham Rd
- 3190 Denham Rd
- 3161 Denham Rd
- 3156 Denham Rd
- 3551 Denham Rd
- 3090 Denham Rd
- 3490 Denham Rd
- 2080 Honeysuckle Rd
- 3128 Denham Rd
- 0 Honeysuckle Rd
- 3010 Denham Rd
- 3552 Denham Rd
- 2267 Honeysuckle Rd
- 0 Honey Suckle Rd
- 2829 Denham Rd
- 2847 Denham Rd
- 2311 Honeysuckle Rd
- 2772 Denham Rd
- 2716 Denham Rd
- 2445 Honeysuckle Rd
Your Personal Tour Guide
Ask me questions while you tour the home.