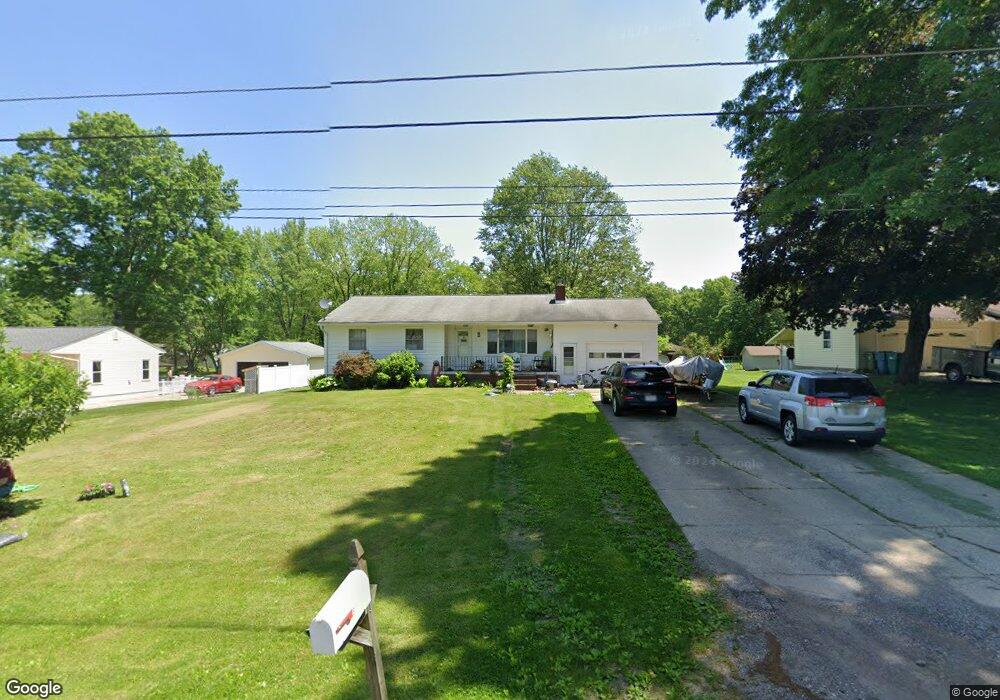
3291 Rowena St Barberton, OH 44203
East Barberton NeighborhoodEstimated Value: $187,292 - $210,000
3
Beds
1
Bath
1,084
Sq Ft
$185/Sq Ft
Est. Value
About This Home
This home is located at 3291 Rowena St, Barberton, OH 44203 and is currently estimated at $200,823, approximately $185 per square foot. 3291 Rowena St is a home located in Summit County with nearby schools including Coventry Middle School, Coventry High School, and St. Francis de Sales School.
Ownership History
Date
Name
Owned For
Owner Type
Purchase Details
Closed on
Nov 22, 2017
Sold by
Truman Michael G and Truman Michelle R
Bought by
Garrett Michelle Dawn
Current Estimated Value
Home Financials for this Owner
Home Financials are based on the most recent Mortgage that was taken out on this home.
Original Mortgage
$96,143
Outstanding Balance
$81,086
Interest Rate
4.5%
Mortgage Type
FHA
Estimated Equity
$119,737
Purchase Details
Closed on
Aug 15, 2010
Sold by
Truman Michael G and Truman Michelle R
Bought by
Truman Michael G and Truman Michelle R
Purchase Details
Closed on
Jun 6, 2007
Sold by
Saylor Leota R
Bought by
Garrett Michelle D
Home Financials for this Owner
Home Financials are based on the most recent Mortgage that was taken out on this home.
Original Mortgage
$113,500
Interest Rate
6.2%
Mortgage Type
Seller Take Back
Purchase Details
Closed on
May 21, 2002
Sold by
Saylor Leota H and Saylor Leota R
Bought by
Saylor Leota R and Leota R Saylor Revocable Living Trust
Create a Home Valuation Report for This Property
The Home Valuation Report is an in-depth analysis detailing your home's value as well as a comparison with similar homes in the area
Home Values in the Area
Average Home Value in this Area
Purchase History
| Date | Buyer | Sale Price | Title Company |
|---|---|---|---|
| Garrett Michelle Dawn | $115,000 | None Available | |
| Truman Michael G | -- | Attorney | |
| Garrett Michelle D | $115,000 | Attorney | |
| Saylor Leota R | -- | -- |
Source: Public Records
Mortgage History
| Date | Status | Borrower | Loan Amount |
|---|---|---|---|
| Open | Garrett Michelle Dawn | $96,143 | |
| Previous Owner | Garrett Michelle D | $113,500 |
Source: Public Records
Tax History Compared to Growth
Tax History
| Year | Tax Paid | Tax Assessment Tax Assessment Total Assessment is a certain percentage of the fair market value that is determined by local assessors to be the total taxable value of land and additions on the property. | Land | Improvement |
|---|---|---|---|---|
| 2025 | $3,131 | $54,342 | $13,269 | $41,073 |
| 2024 | $3,131 | $54,342 | $13,269 | $41,073 |
| 2023 | $3,131 | $54,342 | $13,269 | $41,073 |
| 2022 | $2,634 | $37,738 | $9,216 | $28,522 |
| 2021 | $2,479 | $37,738 | $9,216 | $28,522 |
| 2020 | $2,406 | $37,740 | $9,220 | $28,520 |
| 2019 | $2,371 | $33,920 | $7,170 | $26,750 |
| 2018 | $2,348 | $33,920 | $7,170 | $26,750 |
| 2017 | $2,444 | $33,920 | $7,170 | $26,750 |
| 2016 | $2,438 | $33,920 | $7,170 | $26,750 |
| 2015 | $2,444 | $33,920 | $7,170 | $26,750 |
| 2014 | $2,379 | $33,920 | $7,170 | $26,750 |
| 2013 | $2,524 | $36,470 | $7,170 | $29,300 |
Source: Public Records
Map
Nearby Homes
- 2984 Manchester Rd
- 0 Joyce Ave NW Unit 35 5043152
- 0 Joyce Ave NW Unit 34 5043158
- 32 Joyce Ave
- V/L 1.16 Acres E Tuscarawas Extension
- 2953 Clearfield Ave
- 584 Apple Dr
- 860 Sutherland Ave
- 894 Sutherland Ave
- 2912 Clearfield Ave
- 3719 Bower Ave
- 1129 Winston St
- 2832 Wingate Ave
- 2784 Conway St
- 951 S Azalea Blvd
- 1092 Sutherland Ave
- 802 Portage Lakes Dr
- 796 Portage Lakes Dr
- 721 E Ford Ave
- 986 S Azalea Blvd
- 3281 Rowena St
- 3301 Rowena St
- 3271 Rowena St
- 3311 Rowena St
- 3260 Ethan Allen Rd
- 3290 Rowena Rd
- 3250 Ethan Allen Rd
- 3270 Ethan Allen Rd
- 3321 Rowena St
- 3261 Rowena St
- 3240 Ethan Allen Rd
- 3280 Ethan Allen Rd
- 3280 Rowena St
- 3300 Rowena St
- 3270 Rowena St
- 3310 Rowena St
- 3230 Ethan Allen Rd
- 3290 Ethan Allen Rd
- 3331 Rowena St
- 964 Nola Ave