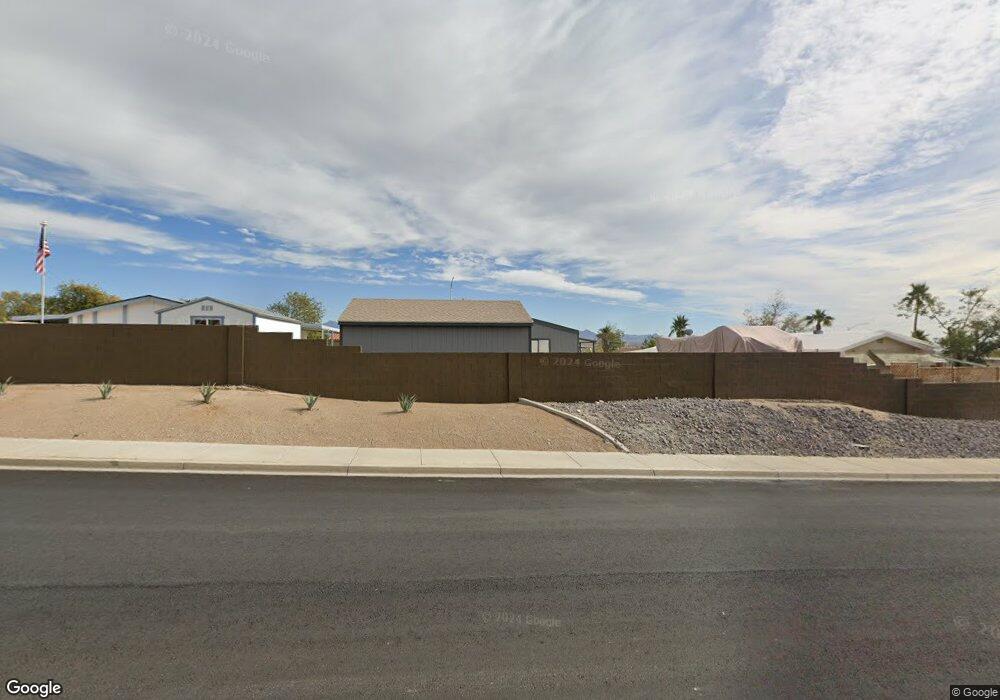
3293 Calanda St Laughlin, NV 89029
Estimated Value: $187,453 - $230,000
3
Beds
2
Baths
1,152
Sq Ft
$185/Sq Ft
Est. Value
About This Home
This home is located at 3293 Calanda St, Laughlin, NV 89029 and is currently estimated at $213,363, approximately $185 per square foot. 3293 Calanda St is a home located in Clark County with nearby schools including William G. Bennett Elementary School and Laughlin Junior/Senior High School.
Ownership History
Date
Name
Owned For
Owner Type
Purchase Details
Closed on
May 27, 2014
Sold by
Cook Charles A and Evans Cook Susan D
Bought by
The Charles And Susan Cook Family Trust
Current Estimated Value
Purchase Details
Closed on
Jun 8, 2005
Sold by
Reynolds Doris L
Bought by
Cook Charles A and Evans Cook Susan D
Home Financials for this Owner
Home Financials are based on the most recent Mortgage that was taken out on this home.
Original Mortgage
$112,500
Outstanding Balance
$58,050
Interest Rate
5.58%
Mortgage Type
Fannie Mae Freddie Mac
Estimated Equity
$155,313
Create a Home Valuation Report for This Property
The Home Valuation Report is an in-depth analysis detailing your home's value as well as a comparison with similar homes in the area
Purchase History
| Date | Buyer | Sale Price | Title Company |
|---|---|---|---|
| The Charles And Susan Cook Family Trust | -- | None Available | |
| Cook Charles A | $125,000 | Southwest Title |
Source: Public Records
Mortgage History
| Date | Status | Borrower | Loan Amount |
|---|---|---|---|
| Open | Cook Charles A | $112,500 |
Source: Public Records
Tax History Compared to Growth
Tax History
| Year | Tax Paid | Tax Assessment Tax Assessment Total Assessment is a certain percentage of the fair market value that is determined by local assessors to be the total taxable value of land and additions on the property. | Land | Improvement |
|---|---|---|---|---|
| 2025 | $710 | $30,509 | $10,150 | $20,359 |
| 2024 | $689 | $30,509 | $10,150 | $20,359 |
| 2023 | $689 | $33,614 | $14,000 | $19,614 |
| 2022 | $669 | $27,784 | $9,800 | $17,984 |
| 2021 | $650 | $25,327 | $8,050 | $17,277 |
| 2020 | $629 | $24,726 | $7,350 | $17,376 |
| 2019 | $610 | $24,001 | $6,650 | $17,351 |
| 2018 | $593 | $21,567 | $6,650 | $14,917 |
| 2017 | $718 | $21,303 | $5,600 | $15,703 |
| 2016 | $561 | $17,775 | $5,250 | $12,525 |
| 2015 | $600 | $17,927 | $5,250 | $12,677 |
| 2014 | $605 | $18,967 | $5,250 | $13,717 |
Source: Public Records
Map
Nearby Homes
- 3253 Calanda St
- 1671 Esquina St
- 3262 Del Monte St
- 1671 Granada St
- 1611 Esquina St
- 3550 Bay Sands Dr Unit 1101
- 3550 Bay Sands Dr Unit 3077
- 3550 Bay Sands Dr Unit 2045
- 3550 Bay Sands Dr Unit 1027
- 3550 Bay Sands Dr Unit 2015
- 3550 Bay Sands Dr Unit 1098
- 3550 Bay Sands Dr Unit 1035
- 3550 Bay Sands Dr Unit 2048
- 3550 Bay Sands Dr Unit 1005
- 3550 Bay Sands Dr Unit 2076
- 3550 Bay Sands Dr Unit 1059
- 3550 Bay Sands Dr Unit 3044
- 3550 Bay Sands Dr Unit 3061
- 3550 Bay Sands Dr Unit 2080
- 3550 Bay Sands Dr Unit 1093
- 3283 Calanda St
- 3303 Calanda St
- 3311 Calanda St
- 3302 Calanda St
- 3263 Calada St Unit 3263
- 3263 Calanda St
- 3323 Calanda St
- 3322 Calanda St
- 3311 Mirador St
- 3333 Calanda St
- 3332 Calanda St
- 3321 Mirador St
- 3343 Calanda St
- 3243 Calanda St
- 3331 Mirador St
- 3342 Calanda St
- 3261 Mirador St
- 3242 Calanda St
- 3341 Mirador St
- 3353 Calanda St
