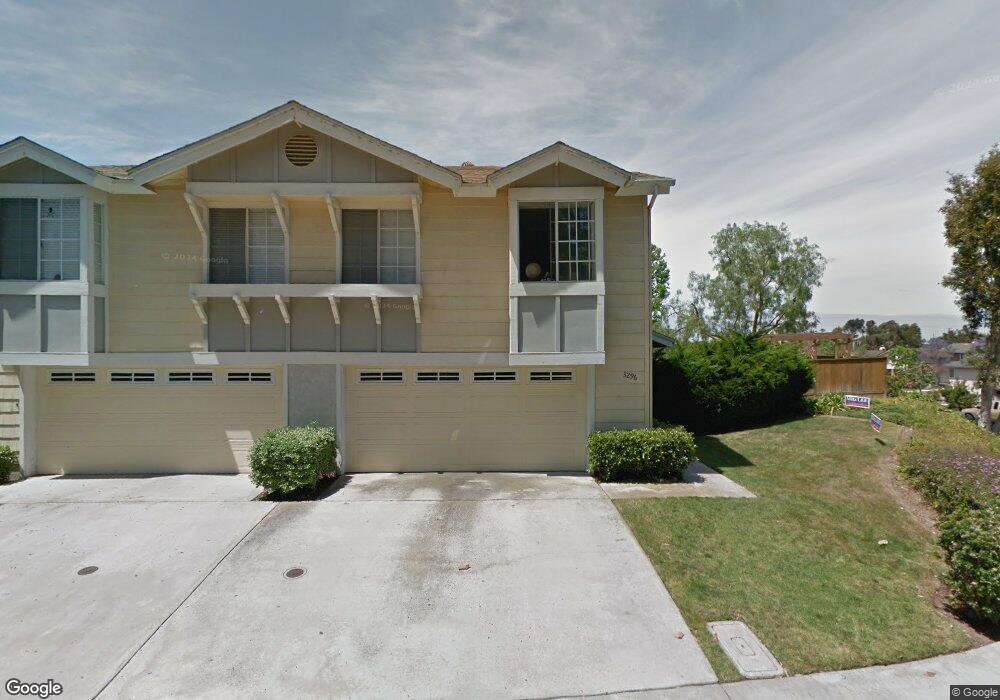
3296 E Fox Run Way San Diego, CA 92111
Clairemont Mesa West NeighborhoodEstimated Value: $1,024,000 - $1,229,105
4
Beds
3
Baths
2,061
Sq Ft
$553/Sq Ft
Est. Value
About This Home
This home is located at 3296 E Fox Run Way, San Diego, CA 92111 and is currently estimated at $1,139,026, approximately $552 per square foot. 3296 E Fox Run Way is a home located in San Diego County with nearby schools including Holmes Elementary, Marston Middle School, and Clairemont High School.
Ownership History
Date
Name
Owned For
Owner Type
Purchase Details
Closed on
May 10, 2013
Sold by
Held James Thomas and Kohatsu Yovanne Sachiko
Bought by
Terpening Troy Erik and Terpening Ingrid Fausta
Current Estimated Value
Home Financials for this Owner
Home Financials are based on the most recent Mortgage that was taken out on this home.
Original Mortgage
$400,000
Outstanding Balance
$282,166
Interest Rate
3.38%
Mortgage Type
Seller Take Back
Estimated Equity
$856,860
Purchase Details
Closed on
Jan 3, 1995
Sold by
Yahnke Dale and Yahnke Julie
Bought by
Held James Thomas and Kohatsu Yovanne Sachiko
Purchase Details
Closed on
Apr 29, 1987
Purchase Details
Closed on
Jun 10, 1983
Create a Home Valuation Report for This Property
The Home Valuation Report is an in-depth analysis detailing your home's value as well as a comparison with similar homes in the area
Home Values in the Area
Average Home Value in this Area
Purchase History
| Date | Buyer | Sale Price | Title Company |
|---|---|---|---|
| Terpening Troy Erik | $400,000 | North American Title Company | |
| Held James Thomas | $195,000 | Chicago Title Company | |
| -- | $153,500 | -- | |
| -- | $109,000 | -- |
Source: Public Records
Mortgage History
| Date | Status | Borrower | Loan Amount |
|---|---|---|---|
| Open | Terpening Troy Erik | $400,000 |
Source: Public Records
Tax History Compared to Growth
Tax History
| Year | Tax Paid | Tax Assessment Tax Assessment Total Assessment is a certain percentage of the fair market value that is determined by local assessors to be the total taxable value of land and additions on the property. | Land | Improvement |
|---|---|---|---|---|
| 2025 | $5,880 | $492,558 | $185,865 | $306,693 |
| 2024 | $5,880 | $482,901 | $182,221 | $300,680 |
| 2023 | $5,748 | $473,434 | $178,649 | $294,785 |
| 2022 | $5,593 | $464,152 | $175,147 | $289,005 |
| 2021 | $5,554 | $455,052 | $171,713 | $283,339 |
| 2020 | $5,486 | $450,387 | $169,953 | $280,434 |
| 2019 | $5,387 | $441,557 | $166,621 | $274,936 |
| 2018 | $5,035 | $432,900 | $163,354 | $269,546 |
| 2017 | $4,914 | $424,412 | $160,151 | $264,261 |
| 2016 | $4,834 | $416,091 | $157,011 | $259,080 |
| 2015 | $4,761 | $409,842 | $154,653 | $255,189 |
| 2014 | $4,685 | $401,815 | $151,624 | $250,191 |
Source: Public Records
Map
Nearby Homes
- 3298 Old Heather Rd
- 3270 W Fox Run Way Unit 2
- 3218 Old Bridgeport Way
- 3226 Old Heather Rd
- 3120 Old Bridgeport Way
- 3710 Old Cobble Rd
- 3516 Old Cobble Rd
- 3014 Old Bridgeport Way
- 5581 Mount Acara Dr
- 3047 Old Bridgeport Way
- 3262 Mount Carol Dr
- 3581 Mount Abbey Ave
- 3405 Aveley Place
- 3161 Mount Tami Dr
- 3413 Rollsreach Dr
- 3173 Via Arcilla
- 3567 Mount Everest Blvd
- 2868-70 Preece St
- 6929 Park Mesa Way Unit 126
- 3432 Mount Ariane Dr
- 3290 E Fox Run Way
- 3284 E Fox Run Way
- 3278 E Fox Run Way Unit 2
- 3285 E Fox Run Way Unit 3
- 3287 E Fox Run Way
- 3289 E Fox Run Way
- 3279 E Fox Run Way
- 3295 E Fox Run Way
- 3292 Old Heather Rd
- 3272 E Fox Run Way
- 3277 E Fox Run Way
- 3286 Old Heather Rd
- 3297 E Fox Run Way
- 3275 E Fox Run Way
- 3299 E Fox Run Way
- 3280 Old Heather Rd Unit 2
- 3269 E Fox Run Way
- 3266 E Fox Run Way
- 3267 E Fox Run Way
- 3274 Old Heather Rd