32996 SE Brooks Rd Boring, OR 97009
Estimated Value: $952,000 - $1,506,000
4
Beds
3
Baths
4,957
Sq Ft
$254/Sq Ft
Est. Value
About This Home
This home is located at 32996 SE Brooks Rd, Boring, OR 97009 and is currently estimated at $1,257,496, approximately $253 per square foot. 32996 SE Brooks Rd is a home located in Clackamas County with nearby schools including East Orient Elementary School, West Orient Middle School, and Sam Barlow High School.
Ownership History
Date
Name
Owned For
Owner Type
Purchase Details
Closed on
Jul 2, 2007
Sold by
Laufer Michael A and Laufer Julie
Bought by
Bourg Matthew E and Bourg Cynthia L
Current Estimated Value
Home Financials for this Owner
Home Financials are based on the most recent Mortgage that was taken out on this home.
Original Mortgage
$678,720
Outstanding Balance
$415,755
Interest Rate
6.21%
Mortgage Type
Purchase Money Mortgage
Estimated Equity
$841,741
Purchase Details
Closed on
Apr 16, 2001
Sold by
Geary Kevin L and Geary Rebecca S
Bought by
Laufer Michael A and Laufer Julie
Home Financials for this Owner
Home Financials are based on the most recent Mortgage that was taken out on this home.
Original Mortgage
$320,000
Interest Rate
7.09%
Mortgage Type
Construction
Create a Home Valuation Report for This Property
The Home Valuation Report is an in-depth analysis detailing your home's value as well as a comparison with similar homes in the area
Home Values in the Area
Average Home Value in this Area
Purchase History
| Date | Buyer | Sale Price | Title Company |
|---|---|---|---|
| Bourg Matthew E | $848,400 | First American | |
| Laufer Michael A | $169,000 | First American |
Source: Public Records
Mortgage History
| Date | Status | Borrower | Loan Amount |
|---|---|---|---|
| Open | Bourg Matthew E | $678,720 | |
| Previous Owner | Laufer Michael A | $320,000 |
Source: Public Records
Tax History
| Year | Tax Paid | Tax Assessment Tax Assessment Total Assessment is a certain percentage of the fair market value that is determined by local assessors to be the total taxable value of land and additions on the property. | Land | Improvement |
|---|---|---|---|---|
| 2025 | $9,619 | $621,249 | -- | -- |
| 2024 | $9,184 | $603,155 | -- | -- |
| 2023 | $9,184 | $585,589 | $0 | $0 |
| 2022 | $8,421 | $568,534 | $0 | $0 |
| 2021 | $8,150 | $551,976 | $0 | $0 |
| 2020 | $7,913 | $535,900 | $0 | $0 |
| 2019 | $7,686 | $520,292 | $0 | $0 |
| 2018 | $7,392 | $505,139 | $0 | $0 |
| 2017 | $7,121 | $490,426 | $0 | $0 |
| 2016 | $6,029 | $476,142 | $0 | $0 |
Source: Public Records
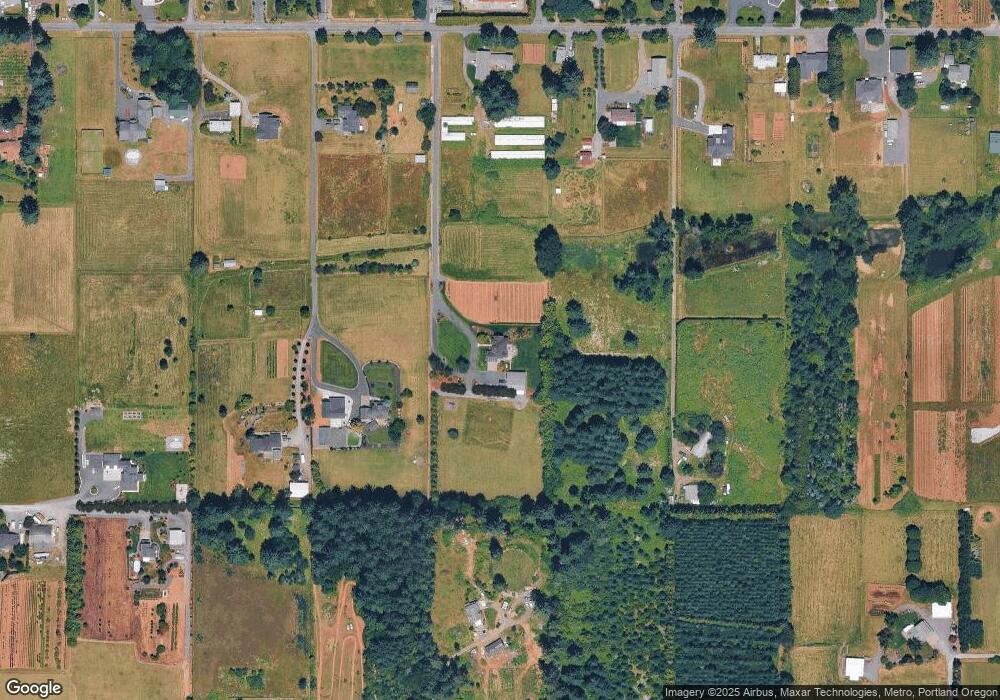
Map
Nearby Homes
- 13025 SE Orient Dr Unit 8
- 35000 SE Bell Maple Dr
- 12721 SE 352nd Ave
- 0 SE Highway 212 Unit 387036591
- 0 SE Highway 212 Unit 523338612
- 33685 SE Kelso Rd
- 35645 SE Dunn Rd
- 35600 SE Dunn Rd
- 11040 SE Mccreary Ln
- 30425 SE Haley Rd
- 3564 SW Binford Ave
- 3516 SW Binford Ave
- 11007 SE Mccreary Ln
- 15061 SE Orient Dr
- 29630 SE Wheeler Rd
- 34603 SE Jarl Rd
- 35543 SE Crescent Rd
- 32022 SE Dodge Park Blvd
- 7411 SE Cottrell Rd
- 7137 SE 322nd Ave
- 32888 SE Brooks Rd
- 33210 SE Brooks Rd
- 33000 SE Brooks Rd
- 32780 SE Brooks Rd
- 33173 SE Brooks Rd
- 32982 SE Brooks Rd
- 33090 SE Brooks Rd
- 32953 SE Compton Rd
- 33220 SE Brooks Rd
- 32702 SE Brooks Rd
- 33025 SE Brooks Rd
- 33081 SE Brooks Rd
- 11994 SE Revenue Rd
- 33300 SE Brooks Rd
- 12002 SE Revenue Rd
- 33185 SE Brooks Rd
- 33400 SE Brooks Rd
- 32680 SE Brooks Rd
- 11440 SE Fencing Place
- 33333 SE Brooks Rd
Your Personal Tour Guide
Ask me questions while you tour the home.