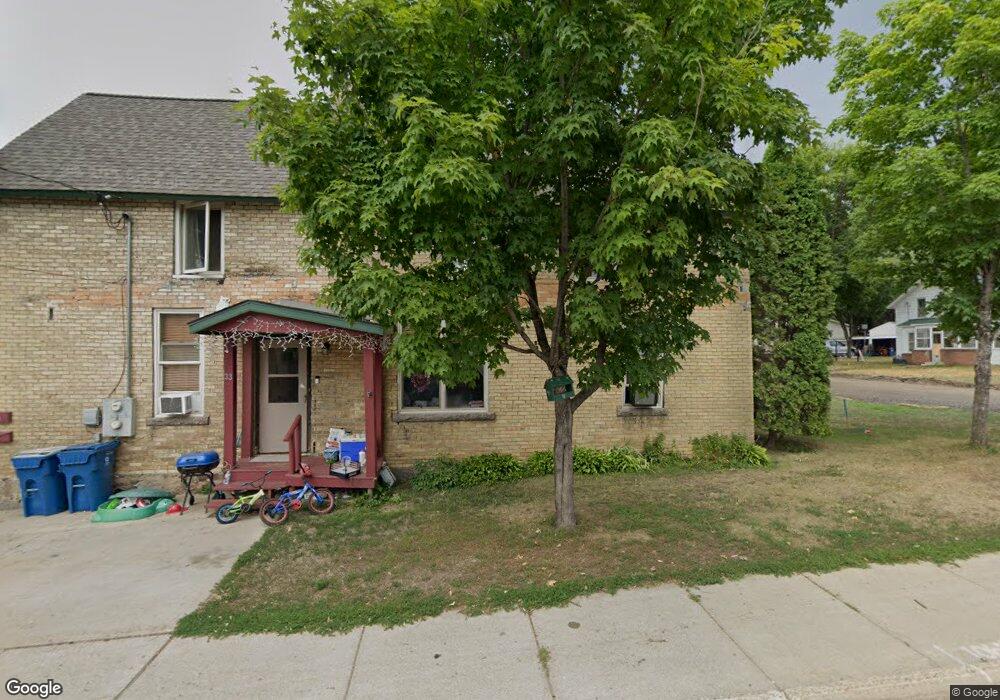
33 3rd Ave S Sauk Rapids, MN 56379
Estimated Value: $164,000 - $203,000
5
Beds
2
Baths
1,656
Sq Ft
$111/Sq Ft
Est. Value
About This Home
This home is located at 33 3rd Ave S, Sauk Rapids, MN 56379 and is currently estimated at $183,263, approximately $110 per square foot. 33 3rd Ave S is a home located in Benton County with nearby schools including Mississippi Heights Elementary School, Sauk Rapids-Rice Middle School, and Sauk Rapids-Rice Senior High School.
Ownership History
Date
Name
Owned For
Owner Type
Purchase Details
Closed on
Dec 4, 2020
Sold by
Schiller Kenneth E
Bought by
Warzecha Steven
Current Estimated Value
Home Financials for this Owner
Home Financials are based on the most recent Mortgage that was taken out on this home.
Original Mortgage
$25,000
Interest Rate
2.26%
Mortgage Type
FHA
Create a Home Valuation Report for This Property
The Home Valuation Report is an in-depth analysis detailing your home's value as well as a comparison with similar homes in the area
Home Values in the Area
Average Home Value in this Area
Purchase History
| Date | Buyer | Sale Price | Title Company |
|---|---|---|---|
| Warzecha Steven | $105,000 | Heartland Title Llc | |
| Warzecha Steven Steven | $105,000 | -- |
Source: Public Records
Mortgage History
| Date | Status | Borrower | Loan Amount |
|---|---|---|---|
| Closed | Warzecha Steven | $25,000 | |
| Open | Warzecha Steven | $80,000 | |
| Closed | Warzecha Steven Steven | $105,000 |
Source: Public Records
Tax History
| Year | Tax Paid | Tax Assessment Tax Assessment Total Assessment is a certain percentage of the fair market value that is determined by local assessors to be the total taxable value of land and additions on the property. | Land | Improvement |
|---|---|---|---|---|
| 2025 | $1,874 | $118,100 | $20,100 | $98,000 |
| 2024 | $1,894 | $114,300 | $20,100 | $94,200 |
| 2023 | $1,464 | $120,600 | $20,100 | $100,500 |
| 2022 | $1,436 | $108,500 | $18,300 | $90,200 |
| 2021 | $1,354 | $96,100 | $18,300 | $77,800 |
| 2020 | $1,352 | $90,800 | $17,600 | $73,200 |
| 2018 | $1,290 | $82,900 | $17,600 | $65,300 |
| 2017 | $1,290 | $78,400 | $17,600 | $60,800 |
| 2016 | $1,280 | $76,900 | $17,600 | $59,300 |
| 2015 | $1,288 | $71,900 | $17,600 | $54,300 |
| 2014 | -- | $67,500 | $17,600 | $49,900 |
| 2013 | -- | $68,600 | $17,600 | $51,000 |
Source: Public Records
Map
Nearby Homes
- 117 6th Ave N
- 707 2nd Ave S
- 608 Summit Ave S
- 507 5th St S
- 805 2nd Ave S
- 809 Broadway Ave S
- 616 2nd Ave N
- 2021 Hillcrest Dr
- 720 3rd Ave N
- 2004 Hillcrest Dr
- 2007 Summit Dr
- 1021 5th St S
- 1715 Hillcrest Rd
- 2161 Mill Pond Dr
- 423 13th Ave S
- 445 13th Ave S
- 2016 Forest Ct
- 32467 County Road 1
- 2177 Mill Pond Dr
- 880 Golden Spike Rd NE
Your Personal Tour Guide
Ask me questions while you tour the home.