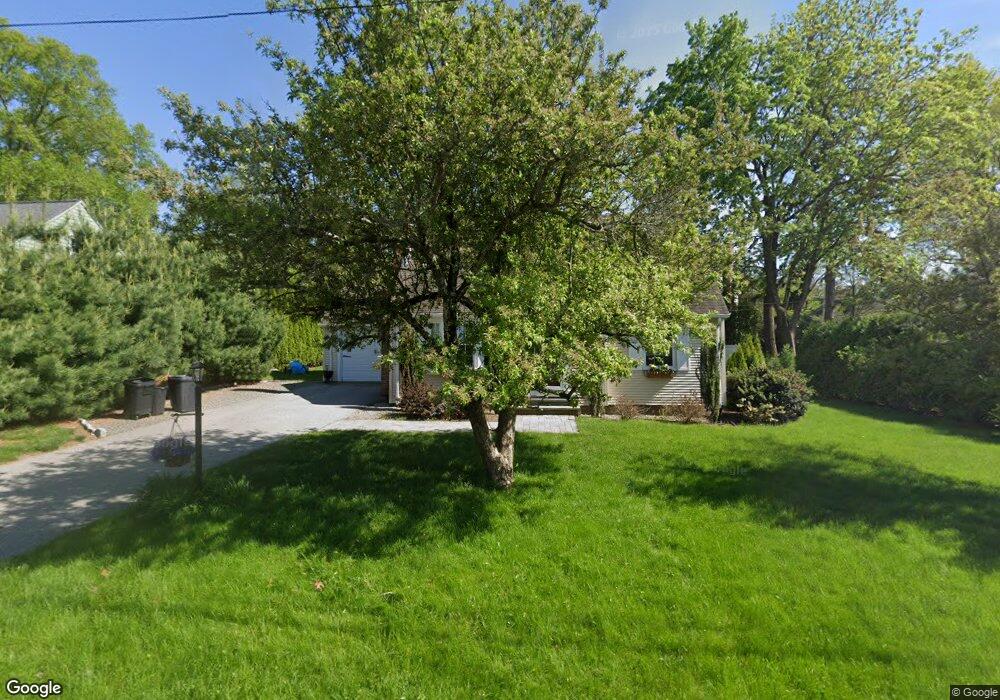
33 Applegate Rd Cranston, RI 02920
Meshanticut NeighborhoodEstimated Value: $764,000 - $962,000
3
Beds
3
Baths
2,893
Sq Ft
$299/Sq Ft
Est. Value
About This Home
This home is located at 33 Applegate Rd, Cranston, RI 02920 and is currently estimated at $864,281, approximately $298 per square foot. 33 Applegate Rd is a home located in Providence County with nearby schools including Glen Hills School, Western Hills Middle School, and Cranston High School West.
Ownership History
Date
Name
Owned For
Owner Type
Purchase Details
Closed on
Nov 30, 2020
Sold by
Myrto Morrissey T
Bought by
Myrto Morrissey T
Current Estimated Value
Purchase Details
Closed on
Dec 26, 2017
Sold by
Morrissey Myrto
Bought by
Myrto Morrissey 1992 T
Purchase Details
Closed on
Dec 31, 2013
Sold by
Morrissey Family Lp
Bought by
Morrissey Myrto
Create a Home Valuation Report for This Property
The Home Valuation Report is an in-depth analysis detailing your home's value as well as a comparison with similar homes in the area
Home Values in the Area
Average Home Value in this Area
Purchase History
| Date | Buyer | Sale Price | Title Company |
|---|---|---|---|
| Myrto Morrissey T | -- | None Available | |
| Myrto Morrissey 1992 T | -- | -- | |
| Morrissey Myrto | -- | -- |
Source: Public Records
Mortgage History
| Date | Status | Borrower | Loan Amount |
|---|---|---|---|
| Previous Owner | Morrissey Myrto | $500,000 | |
| Previous Owner | Morrissey Myrto | $300,000 |
Source: Public Records
Tax History
| Year | Tax Paid | Tax Assessment Tax Assessment Total Assessment is a certain percentage of the fair market value that is determined by local assessors to be the total taxable value of land and additions on the property. | Land | Improvement |
|---|---|---|---|---|
| 2025 | $10,704 | $771,200 | $163,200 | $608,000 |
| 2024 | $10,496 | $771,200 | $163,200 | $608,000 |
| 2023 | $9,533 | $504,400 | $112,600 | $391,800 |
| 2022 | $9,336 | $504,400 | $112,600 | $391,800 |
| 2021 | $9,079 | $504,400 | $112,600 | $391,800 |
| 2020 | $9,222 | $444,000 | $124,600 | $319,400 |
| 2019 | $9,222 | $444,000 | $124,600 | $319,400 |
| 2018 | $9,009 | $444,000 | $124,600 | $319,400 |
| 2017 | $9,135 | $398,200 | $124,600 | $273,600 |
| 2016 | $8,940 | $398,200 | $124,600 | $273,600 |
| 2015 | $8,940 | $398,200 | $124,600 | $273,600 |
| 2014 | $8,654 | $378,900 | $120,600 | $258,300 |
Source: Public Records
Map
Nearby Homes
- 203 Dean Ridge Ct
- 7 Oak Tree Ln
- 12 Coldbrook Ct
- 105 Coldbrook Dr
- 210 Summit Dr
- 9 Williston St
- 29 Valley St
- 51 E Bel Air Rd
- 242 Brettonwoods Dr
- 217 Belvedere Dr
- 135 Meshanticut Valley Pkwy
- 141 Glen Ridge Rd
- 140 Lake View Rd
- 175 Hoffman Ave Unit 102
- 178 Highland St
- 157 Sweetbriar Dr
- 58 Meredith Dr
- 1000 Chapel View Blvd Unit 312
- 29 Poppy Dr
- 82 Mountain Laurel Dr
Your Personal Tour Guide
Ask me questions while you tour the home.