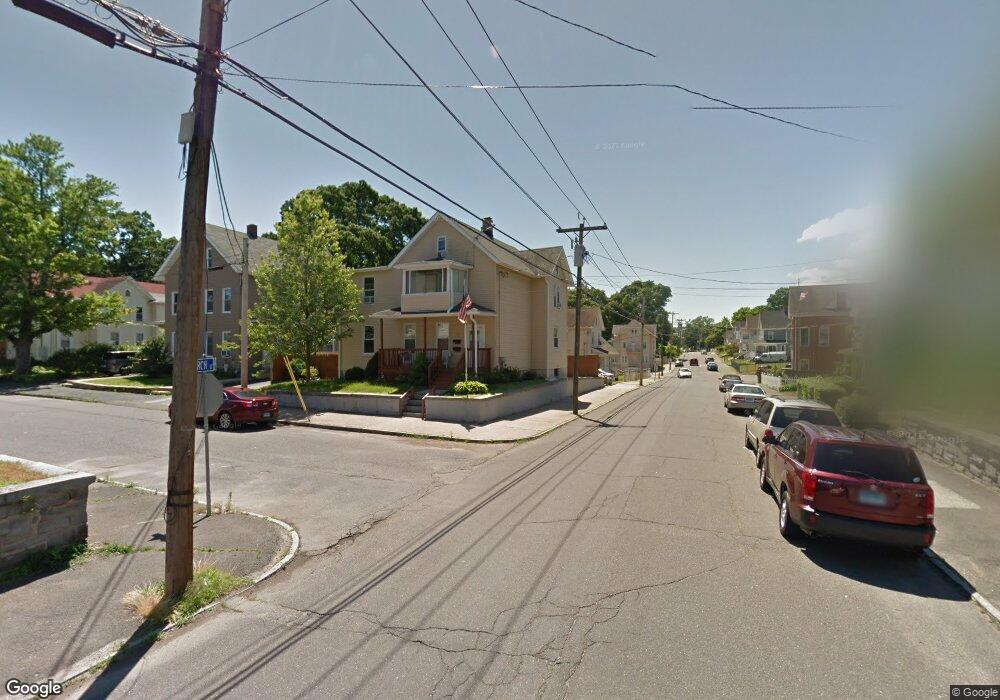
33 Arch St Ansonia, CT 06401
Estimated Value: $364,901 - $464,000
5
Beds
2
Baths
1,858
Sq Ft
$221/Sq Ft
Est. Value
About This Home
This home is located at 33 Arch St, Ansonia, CT 06401 and is currently estimated at $411,475, approximately $221 per square foot. 33 Arch St is a home located in New Haven County with nearby schools including Ansonia Middle School, Ansonia High School, and Assumption School.
Ownership History
Date
Name
Owned For
Owner Type
Purchase Details
Closed on
Oct 11, 2012
Sold by
Constant Jorel
Bought by
Gmac Mtg Llc
Current Estimated Value
Purchase Details
Closed on
Jul 31, 2001
Sold by
Brader Mark and Brader Deborah
Bought by
Johnson Janice L
Home Financials for this Owner
Home Financials are based on the most recent Mortgage that was taken out on this home.
Original Mortgage
$112,238
Interest Rate
7.18%
Create a Home Valuation Report for This Property
The Home Valuation Report is an in-depth analysis detailing your home's value as well as a comparison with similar homes in the area
Home Values in the Area
Average Home Value in this Area
Purchase History
| Date | Buyer | Sale Price | Title Company |
|---|---|---|---|
| Gmac Mtg Llc | $115,000 | -- | |
| Johnson Janice L | $115,000 | -- |
Source: Public Records
Mortgage History
| Date | Status | Borrower | Loan Amount |
|---|---|---|---|
| Previous Owner | Johnson Janice L | $50,000 | |
| Previous Owner | Johnson Janice L | $111,147 | |
| Previous Owner | Johnson Janice L | $112,238 |
Source: Public Records
Tax History
| Year | Tax Paid | Tax Assessment Tax Assessment Total Assessment is a certain percentage of the fair market value that is determined by local assessors to be the total taxable value of land and additions on the property. | Land | Improvement |
|---|---|---|---|---|
| 2025 | $4,954 | $173,530 | $37,380 | $136,150 |
| 2024 | $4,597 | $173,530 | $37,380 | $136,150 |
| 2023 | $4,553 | $173,530 | $37,380 | $136,150 |
| 2022 | $4,071 | $107,700 | $37,800 | $69,900 |
| 2021 | $4,071 | $107,700 | $37,800 | $69,900 |
| 2020 | $7,211 | $107,700 | $37,800 | $69,900 |
| 2019 | $4,071 | $107,700 | $37,800 | $69,900 |
| 2018 | $4,019 | $107,700 | $37,800 | $69,900 |
| 2017 | $3,262 | $87,400 | $37,900 | $49,500 |
| 2016 | $3,262 | $87,400 | $37,900 | $49,500 |
| 2015 | $3,279 | $87,400 | $37,900 | $49,500 |
| 2014 | $3,375 | $87,400 | $37,900 | $49,500 |
| 2013 | $3,438 | $87,400 | $37,900 | $49,500 |
Source: Public Records
Map
Nearby Homes
- 16 Holbrook Ct
- 24 Lester St
- 185 Wakelee Ave
- 106 Howard Ave
- 10 Clarkson St Unit 12
- 207 Westfield Ave
- 39 Bassett St
- 8 Reichelt Terrace
- 19 5th St
- 91 4th St Unit 7
- 61 Garden St
- 222 1/2 N State St
- 257 N State St
- 10 Ells St
- 110 Beaver St
- 7 Cook St
- 45 Orchard St
- 91 Division St
- 22 Woodbridge Ave
- 226 Seymour Ave Unit 228
Your Personal Tour Guide
Ask me questions while you tour the home.