Estimated Value: $2,033,896 - $2,302,000
4
Beds
4
Baths
3,060
Sq Ft
$708/Sq Ft
Est. Value
About This Home
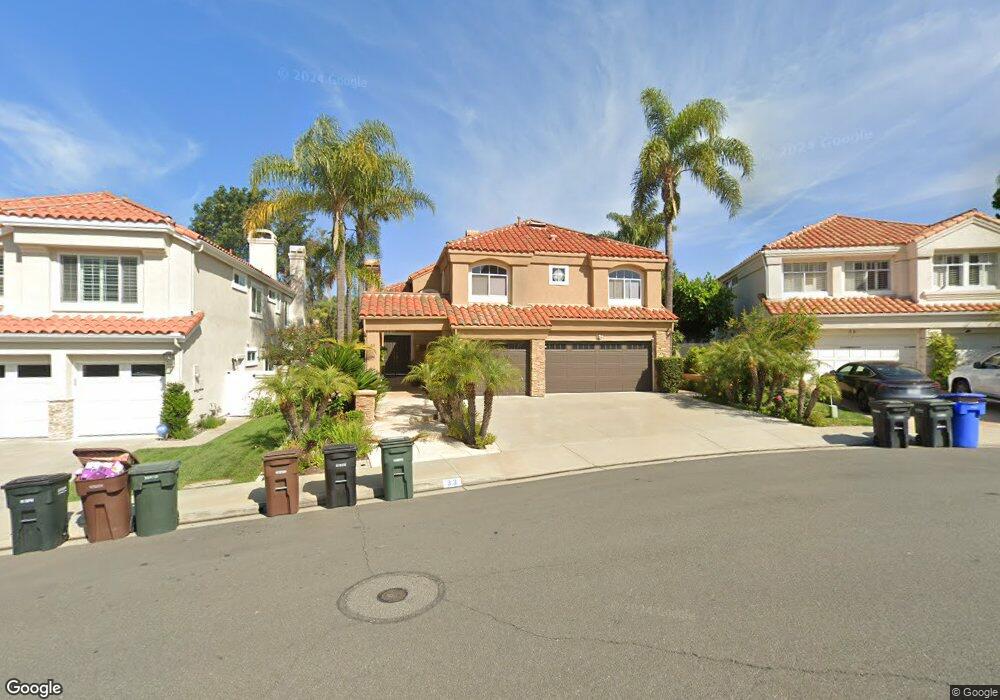
This home is located at 33 Argos, Laguna Niguel, CA 92677 and is currently estimated at $2,167,974, approximately $708 per square foot. 33 Argos is a home located in Orange County with nearby schools including George White Elementary, Niguel Hills Middle School, and Dana Hills High School.
Ownership History
Date
Name
Owned For
Owner Type
Purchase Details
Closed on
Jul 13, 2023
Sold by
Ghafari Hamid and Ghafari Sima M
Bought by
Ghafari Ha1vhd And Sima Revocable Family Trus and Ghafari
Current Estimated Value
Purchase Details
Closed on
Dec 23, 2004
Sold by
Dry Jane
Bought by
Ghafari Hamid and Ghafari Sima M
Home Financials for this Owner
Home Financials are based on the most recent Mortgage that was taken out on this home.
Original Mortgage
$541,500
Interest Rate
4.37%
Mortgage Type
Negative Amortization
Purchase Details
Closed on
Oct 21, 1995
Sold by
Dry Jane Putney
Bought by
Dry Jane
Purchase Details
Closed on
Sep 8, 1994
Sold by
Parsa Shokrolah and Parsa Ashraf
Bought by
Dry Jane Putney
Create a Home Valuation Report for This Property
The Home Valuation Report is an in-depth analysis detailing your home's value as well as a comparison with similar homes in the area
Home Values in the Area
Average Home Value in this Area
Purchase History
| Date | Buyer | Sale Price | Title Company |
|---|---|---|---|
| Ghafari Ha1vhd And Sima Revocable Family Trus | -- | None Listed On Document | |
| Ghafari Hamid | $959,000 | First Southwestern Title Co | |
| Dry Jane | -- | -- | |
| Dry Jane Putney | $384,000 | Guardian Title Company | |
| Dry Jane Putney | -- | Guardian Title Company |
Source: Public Records
Mortgage History
| Date | Status | Borrower | Loan Amount |
|---|---|---|---|
| Previous Owner | Ghafari Hamid | $541,500 |
Source: Public Records
Tax History Compared to Growth
Tax History
| Year | Tax Paid | Tax Assessment Tax Assessment Total Assessment is a certain percentage of the fair market value that is determined by local assessors to be the total taxable value of land and additions on the property. | Land | Improvement |
|---|---|---|---|---|
| 2025 | $13,206 | $1,336,755 | $872,420 | $464,335 |
| 2024 | $13,206 | $1,310,545 | $855,314 | $455,231 |
| 2023 | $12,925 | $1,284,849 | $838,544 | $446,305 |
| 2022 | $12,677 | $1,259,656 | $822,102 | $437,554 |
| 2021 | $12,432 | $1,234,957 | $805,982 | $428,975 |
| 2020 | $12,307 | $1,222,295 | $797,718 | $424,577 |
| 2019 | $12,063 | $1,198,329 | $782,077 | $416,252 |
| 2018 | $11,830 | $1,174,833 | $766,742 | $408,091 |
| 2017 | $11,598 | $1,151,798 | $751,708 | $400,090 |
| 2016 | $11,375 | $1,129,214 | $736,968 | $392,246 |
| 2015 | $11,203 | $1,112,253 | $725,898 | $386,355 |
| 2014 | $9,231 | $917,000 | $570,419 | $346,581 |
Source: Public Records
Map
Nearby Homes