
Seller's Agent in 2025
Wendy Poudrette
Foster-Healey Real Estate
(978) 630-2070
58 in this area
171 Total Sales
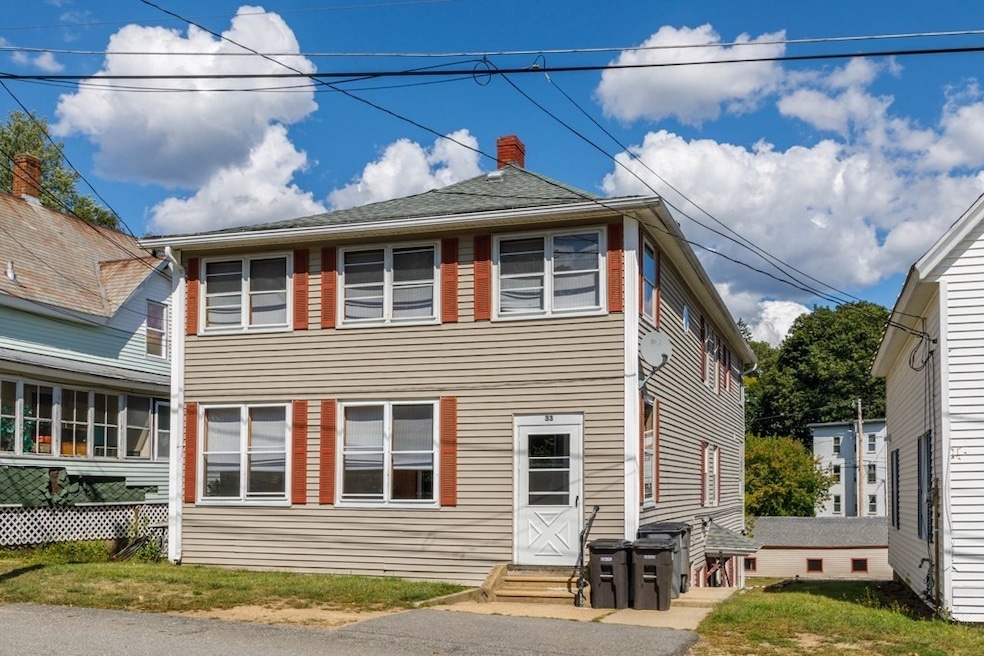


This longtime family-owned 3-family home is hitting the market for the first time in decades—an exceptional opportunity for investors, owner-occupants, or multigenerational living. Each of the three spacious units have been well maintained and offers separate utilities and efficient gas heat, making this a low-maintenance and high-potential property. A standout feature is the rare 8-car detached garage, which presents a valuable opportunity for additional rental income, storage, or use by contractors or hobbyists. The property also includes private outdoor space, welcoming porches, and the potential for off-street parking. Located in a convenient area close to public transit, highways, schools, and shopping, this home combines long-term stability with future upside. Whether you're looking to live in one unit and rent the others or add a strong asset to your portfolio, this is a must-see opportunity.
| Date | Type | Sale Price | Title Company |
|---|---|---|---|
| Quit Claim Deed | $449,900 | -- | |
| Deed | -- | -- | |
| Deed | -- | -- | |
| Deed | $1,000 | -- |
| Date | Status | Loan Amount | Loan Type |
|---|---|---|---|
| Open | $359,920 | New Conventional | |
| Previous Owner | $162,500 | Purchase Money Mortgage | |
| Previous Owner | $90,000 | No Value Available |
| Date | Event | Price | List to Sale | Price per Sq Ft |
|---|---|---|---|---|
| 10/10/2025 10/10/25 | Sold | $449,900 | 0.0% | $241 / Sq Ft |
| 09/12/2025 09/12/25 | Pending | -- | -- | -- |
| 09/04/2025 09/04/25 | For Sale | $449,900 | -- | $241 / Sq Ft |
| Year | Tax Paid | Tax Assessment Tax Assessment Total Assessment is a certain percentage of the fair market value that is determined by local assessors to be the total taxable value of land and additions on the property. | Land | Improvement |
|---|---|---|---|---|
| 2025 | $49 | $341,400 | $67,500 | $273,900 |
| 2024 | $3,965 | $264,500 | $61,400 | $203,100 |
| 2023 | $3,750 | $232,500 | $60,500 | $172,000 |
| 2022 | $3,588 | $193,000 | $45,800 | $147,200 |
| 2021 | $3,307 | $165,000 | $39,800 | $125,200 |
| 2020 | $2,957 | $149,800 | $39,800 | $110,000 |
| 2019 | $2,848 | $141,400 | $39,800 | $101,600 |
| 2018 | $2,659 | $131,200 | $39,800 | $91,400 |
| 2017 | $2,617 | $127,800 | $39,800 | $88,000 |
| 2016 | $2,616 | $127,800 | $39,800 | $88,000 |
| 2015 | $3,095 | $154,900 | $39,800 | $115,100 |
| 2014 | $2,942 | $155,900 | $44,200 | $111,700 |
Seller's Agent in 2025
Wendy Poudrette
Foster-Healey Real Estate
(978) 630-2070
58 in this area
171 Total Sales
Buyer's Agent in 2025
Lana Kopsala
Coldwell Banker Realty - Leominster
(978) 855-9112
21 in this area
373 Total Sales
Source: MLS Property Information Network (MLS PIN)
MLS Number: 73425991
APN: GARD-000027M-000024-000015
Disclaimer: Certain information contained herein is derived from information provided by parties other than Homes.com. All information provided is deemed reliable, but is not guaranteed to be accurate and should be independently verified.
![]() The property listing data and information, or the Images, set forth herein were provided to MLS Property Information Network, Inc. from third party sources, including sellers, lessors and public records, and were compiled by MLS Property Information Network, Inc. The property listing data and information, and the Images, are for the personal, non-commercial use of consumers having a good faith interest in purchasing or leasing listed properties of the type displayed to them and may not be used for any purpose other than to identify prospective properties which such consumers may have a good faith interest in purchasing or leasing. MLS Property Information Network, Inc. and its subscribers disclaim any and all representations and warranties as to the accuracy of the property listing data and information, or as to the accuracy of any of the Images, set forth herein.
The property listing data and information, or the Images, set forth herein were provided to MLS Property Information Network, Inc. from third party sources, including sellers, lessors and public records, and were compiled by MLS Property Information Network, Inc. The property listing data and information, and the Images, are for the personal, non-commercial use of consumers having a good faith interest in purchasing or leasing listed properties of the type displayed to them and may not be used for any purpose other than to identify prospective properties which such consumers may have a good faith interest in purchasing or leasing. MLS Property Information Network, Inc. and its subscribers disclaim any and all representations and warranties as to the accuracy of the property listing data and information, or as to the accuracy of any of the Images, set forth herein.
Ask me questions while you tour the home.