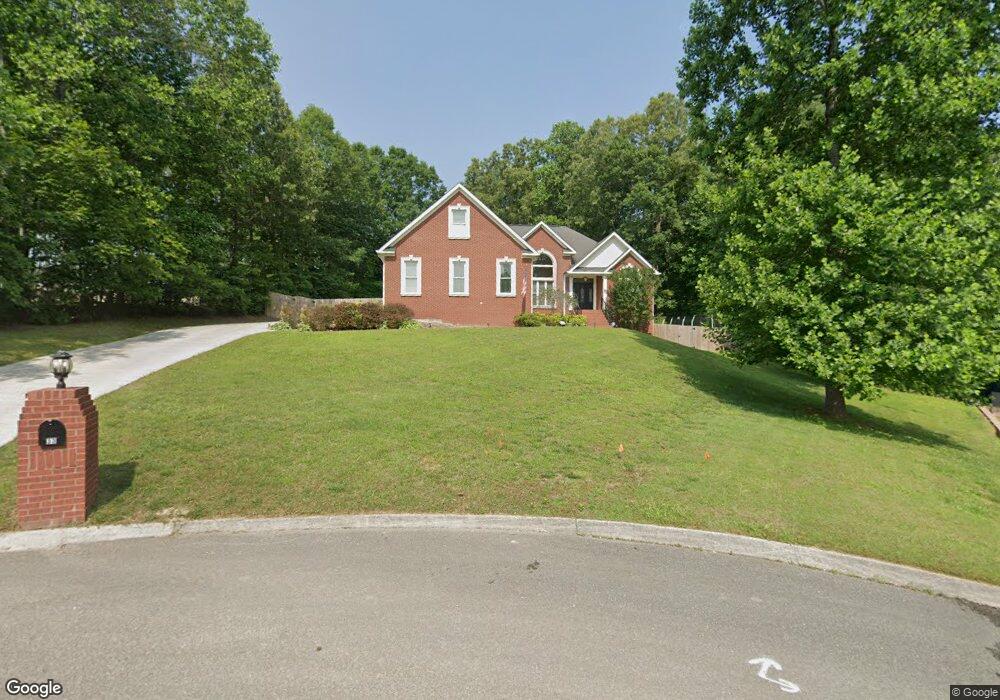
33 Broken Tree Chickamauga, GA 30707
Estimated Value: $478,769 - $597,000
Studio
2
Baths
2,331
Sq Ft
$235/Sq Ft
Est. Value
About This Home
This home is located at 33 Broken Tree, Chickamauga, GA 30707 and is currently estimated at $546,692, approximately $234 per square foot. 33 Broken Tree is a home located in Walker County with nearby schools including Cherokee Ridge Elementary School, Rossville Middle School, and Ridgeland High School.
Ownership History
Date
Name
Owned For
Owner Type
Purchase Details
Closed on
Jan 9, 2020
Sold by
Price Eric B
Bought by
Turner Tiffany R and Turner Jeremy E
Current Estimated Value
Home Financials for this Owner
Home Financials are based on the most recent Mortgage that was taken out on this home.
Original Mortgage
$100,000
Outstanding Balance
$87,636
Interest Rate
3.73%
Mortgage Type
New Conventional
Estimated Equity
$459,056
Purchase Details
Closed on
Mar 16, 2012
Sold by
Bailey Randy
Bought by
Price Eric B
Home Financials for this Owner
Home Financials are based on the most recent Mortgage that was taken out on this home.
Original Mortgage
$221,147
Interest Rate
3.89%
Mortgage Type
FHA
Purchase Details
Closed on
Jul 27, 2005
Sold by
Not Provided
Bought by
Bailey Randy and Bailey Lisa
Purchase Details
Closed on
Dec 1, 1999
Bought by
Johnson Tony A and James Mike
Create a Home Valuation Report for This Property
The Home Valuation Report is an in-depth analysis detailing your home's value as well as a comparison with similar homes in the area
Purchase History
| Date | Buyer | Sale Price | Title Company |
|---|---|---|---|
| Turner Tiffany R | $302,000 | -- | |
| Price Eric B | $226,900 | -- | |
| Bailey Randy | $35,500 | -- | |
| Johnson Tony A | $79,000 | -- |
Source: Public Records
Mortgage History
| Date | Status | Borrower | Loan Amount |
|---|---|---|---|
| Open | Turner Tiffany R | $100,000 | |
| Previous Owner | Price Eric B | $221,147 |
Source: Public Records
Tax History
| Year | Tax Paid | Tax Assessment Tax Assessment Total Assessment is a certain percentage of the fair market value that is determined by local assessors to be the total taxable value of land and additions on the property. | Land | Improvement |
|---|---|---|---|---|
| 2025 | $4,295 | $202,843 | $16,800 | $186,043 |
| 2024 | $4,191 | $190,310 | $16,000 | $174,310 |
| 2023 | $4,085 | $181,440 | $16,000 | $165,440 |
| 2022 | $3,828 | $156,136 | $13,400 | $142,736 |
| 2021 | $3,308 | $132,517 | $13,400 | $119,117 |
| 2020 | $2,400 | $82,378 | $13,400 | $68,978 |
| 2019 | $2,443 | $82,378 | $13,400 | $68,978 |
| 2018 | $2,180 | $82,378 | $13,400 | $68,978 |
| 2017 | $2,668 | $82,378 | $13,400 | $68,978 |
| 2016 | $2,146 | $82,378 | $13,400 | $68,978 |
| 2015 | $2,422 | $88,000 | $13,400 | $74,600 |
| 2014 | $2,285 | $88,000 | $13,400 | $74,600 |
| 2013 | -- | $88,000 | $13,400 | $74,600 |
Source: Public Records
Map
Nearby Homes
- 550 Osborn Rd
- 117 S Forest Rd
- 191 Haleys Cove Dr
- 30 Boseman Ln
- 633 E Garden Farm Rd
- 1208 Johnson Rd
- 115 Wilder St
- 923 Crest Dr
- 55 Rutledge St
- 944 Hurtt Rd
- 614 W Garden Farm Rd
- 932 Johnson Rd
- 535 E Garden Farm Rd
- 5.28 ACRES Johnson Rd
- 1068 Rogers Rd
- 140 Arlington Dr
- 146 Arlington Dr
- 108 Arlington Dr
- 116 Arlington Dr
- 100 Arlington Dr
- 33 Broken Tree
- 45 Broken Tree
- 45 Broken Tree
- 24 Ivy Log Crest
- Lot 10 Broken Tree
- Lot 9 Broken Tree
- Lot 6 Broken Tree
- Lot 9 Broken Tree Ln
- Lot 10 Broken Tree Ln
- 0 Ivy Log Crest Unit 1119297
- 0 Ivy Log Crest Unit 1355018
- 0 Ivy Log Crest Unit 1049513
- 0 Ivy Log Crest Unit 1295479
- 12 Ivy Log Crest
- Lot 6 Broken Tree Ln
- 48 Ivy Log Crescent
- 6 Broken Tree Ln
- 12 Broken Tree
- 12 Broken Tree Unit LOT 5
- 12 Broken Tree
Your Personal Tour Guide
Ask me questions while you tour the home.