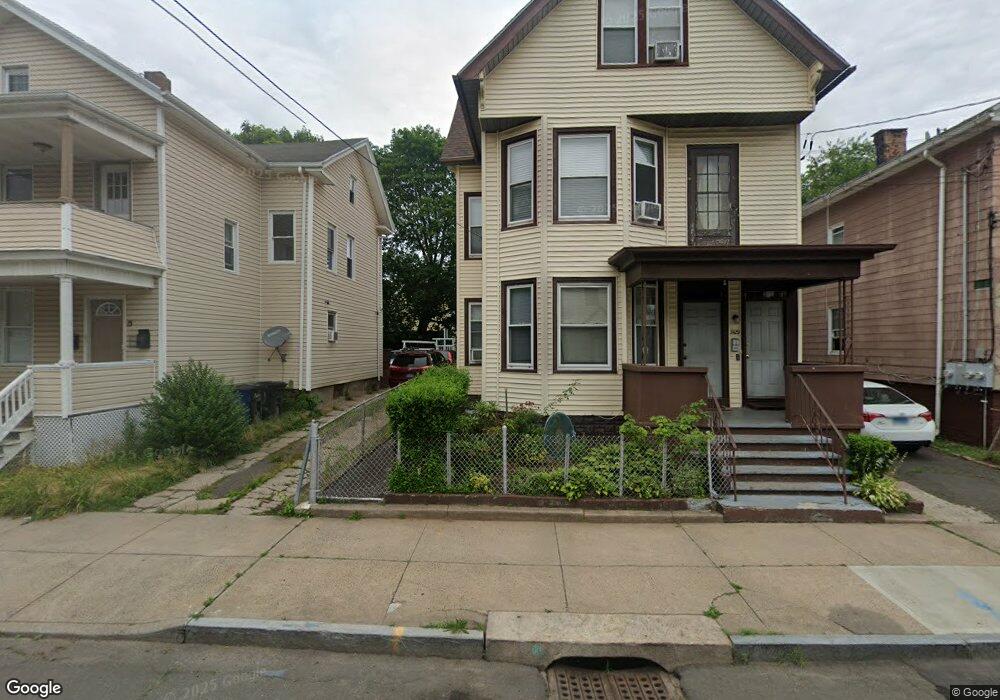
33 Button St New Haven, CT 06519
The Hill NeighborhoodEstimated Value: $229,000 - $374,000
8
Beds
3
Baths
2,736
Sq Ft
$116/Sq Ft
Est. Value
About This Home
This home is located at 33 Button St, New Haven, CT 06519 and is currently estimated at $317,875, approximately $116 per square foot. 33 Button St is a home located in New Haven County with nearby schools including John C. Daniels and St Martin De Porres Academy.
Ownership History
Date
Name
Owned For
Owner Type
Purchase Details
Closed on
Sep 11, 2025
Sold by
Gatsby Garden Llc
Bought by
522 Elm Street Llc
Current Estimated Value
Purchase Details
Closed on
Jun 25, 2025
Sold by
Vr Investments Delaware L
Bought by
Gatsby Garden Llc
Purchase Details
Closed on
Jul 14, 2021
Sold by
Vr Investments Llc
Bought by
Vr Inv Delaware Llc
Purchase Details
Closed on
May 26, 2017
Sold by
Shadmit Holdings Llc
Bought by
Vr Investments Llc
Purchase Details
Closed on
Apr 7, 2017
Sold by
Williams Racquel B
Bought by
Columnas Holdings Llc
Purchase Details
Closed on
Aug 12, 2010
Sold by
Williams Monica
Bought by
Williams Racquel Bianca
Purchase Details
Closed on
Oct 24, 2003
Sold by
Department Of Housing & Urban Dev
Bought by
Williams Monica
Purchase Details
Closed on
Jun 23, 1997
Sold by
Wali Abdur R
Bought by
Wali Aalyah
Home Financials for this Owner
Home Financials are based on the most recent Mortgage that was taken out on this home.
Original Mortgage
$29,600
Interest Rate
7.87%
Mortgage Type
Purchase Money Mortgage
Create a Home Valuation Report for This Property
The Home Valuation Report is an in-depth analysis detailing your home's value as well as a comparison with similar homes in the area
Home Values in the Area
Average Home Value in this Area
Purchase History
| Date | Buyer | Sale Price | Title Company |
|---|---|---|---|
| 522 Elm Street Llc | $790,000 | -- | |
| Gatsby Garden Llc | $587,500 | -- | |
| Vr Inv Delaware Llc | -- | None Available | |
| Vr Inv Delaware Llc | -- | None Available | |
| Vr Inv Delaware Llc | -- | None Available | |
| Vr Investments Llc | -- | -- | |
| Vr Investments Llc | -- | -- | |
| Columnas Holdings Llc | $92,500 | -- | |
| Columnas Holdings Llc | $92,500 | -- | |
| Williams Racquel Bianca | -- | -- | |
| Williams Racquel Bianca | -- | -- | |
| Williams Monica | $30,700 | -- | |
| Williams Monica | $30,700 | -- | |
| Wali Aalyah | $30,000 | -- | |
| Wali Aalyah | $30,000 | -- |
Source: Public Records
Mortgage History
| Date | Status | Borrower | Loan Amount |
|---|---|---|---|
| Previous Owner | Wali Aalyah | $29,600 |
Source: Public Records
Tax History Compared to Growth
Tax History
| Year | Tax Paid | Tax Assessment Tax Assessment Total Assessment is a certain percentage of the fair market value that is determined by local assessors to be the total taxable value of land and additions on the property. | Land | Improvement |
|---|---|---|---|---|
| 2025 | $6,534 | $165,830 | $23,100 | $142,730 |
| 2024 | $6,384 | $165,830 | $23,100 | $142,730 |
| 2023 | $6,169 | $165,830 | $23,100 | $142,730 |
| 2022 | $6,592 | $165,830 | $23,100 | $142,730 |
| 2021 | $4,177 | $95,200 | $19,880 | $75,320 |
| 2020 | $4,177 | $95,200 | $19,880 | $75,320 |
| 2019 | $4,092 | $95,200 | $19,880 | $75,320 |
| 2018 | $4,092 | $95,200 | $19,880 | $75,320 |
| 2017 | $3,682 | $95,200 | $19,880 | $75,320 |
| 2016 | $3,121 | $75,110 | $11,340 | $63,770 |
| 2015 | $3,121 | $75,110 | $11,340 | $63,770 |
| 2014 | $3,121 | $75,110 | $11,340 | $63,770 |
Source: Public Records
Map
Nearby Homes
- 46 Arthur St
- 51 Arthur St
- 148 Rosette St
- 46 Hurlburt St
- 23 Dewitt St
- 148 Plymouth St
- 111 Morris St
- 133 Plymouth St
- 41 Cassius St
- 82 1st St
- 32 Lamberton St
- 26 Lamberton St
- 211 Kimberly Ave
- 45 Frank St
- 76 3rd St
- 33 Liberty St Unit M
- 46 Liberty St
- 25 Liberty St Unit E
- 194 Ella T Grasso Blvd
- 72 Daggett St
- 33 Button St Unit 2ND
- 33 Button St Unit 2
- 33 Button St Unit 2ND F
- 33 Button St Unit 1ST
- 29 Button St
- 25 Button St
- 25 Button St Unit 2
- 25 Button St Unit 1
- 45 Button St
- 21 Button St
- 21 Button St Unit B
- 21 Button St Unit 2nd Floor
- 40 Arthur St
- 47 Button St
- 44 Arthur St
- 40 Button St Unit 40
- 22 Arthur St
- 32 Button St
- 38 Button St
- 13 Button St