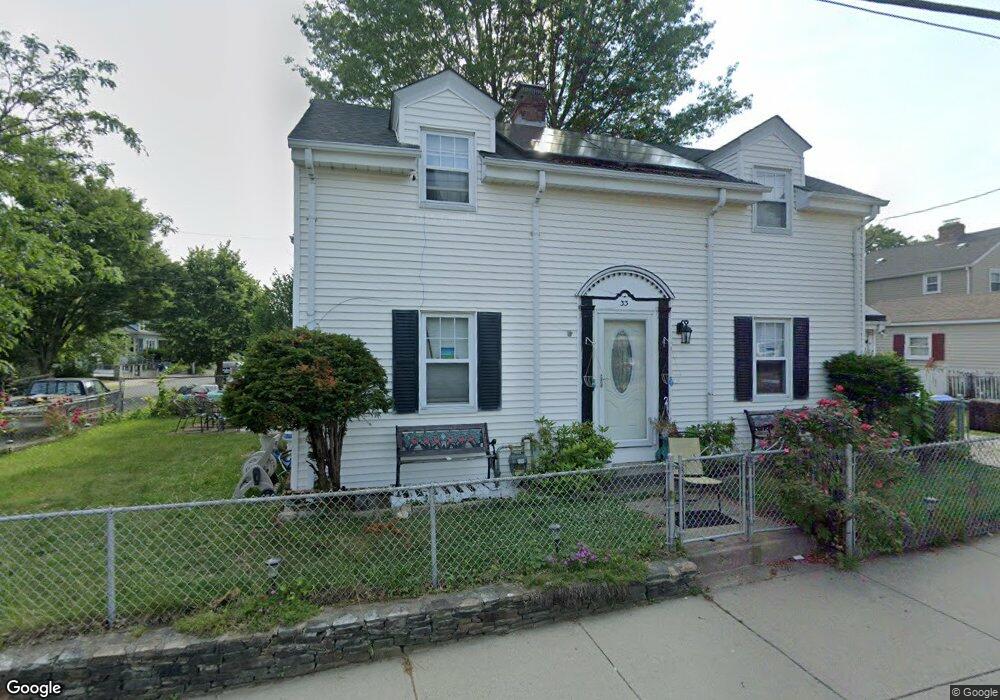
33 Cactus St Providence, RI 02905
Washington Park NeighborhoodEstimated Value: $323,000 - $392,835
3
Beds
2
Baths
1,507
Sq Ft
$243/Sq Ft
Est. Value
About This Home
This home is located at 33 Cactus St, Providence, RI 02905 and is currently estimated at $366,459, approximately $243 per square foot. 33 Cactus St is a home located in Providence County with nearby schools including Asa Messer Elementary School, Charles N. Fortes Elementary School, and Alan Shawn Feinstein Elementary.
Ownership History
Date
Name
Owned For
Owner Type
Purchase Details
Closed on
Apr 13, 2011
Sold by
Driscoll Keith E and Driscoll Jennifer
Bought by
Collazo William - and Collazo Deborah R
Current Estimated Value
Home Financials for this Owner
Home Financials are based on the most recent Mortgage that was taken out on this home.
Original Mortgage
$96,490
Outstanding Balance
$66,610
Interest Rate
4.89%
Mortgage Type
Purchase Money Mortgage
Estimated Equity
$299,849
Purchase Details
Closed on
Mar 16, 2003
Sold by
Hatch Harsha J
Bought by
Driscoll Keith E
Home Financials for this Owner
Home Financials are based on the most recent Mortgage that was taken out on this home.
Original Mortgage
$123,300
Interest Rate
5.94%
Purchase Details
Closed on
Jul 16, 1997
Sold by
Britto Vincent J and Britto Ernestine
Bought by
Hatch Marsha J
Create a Home Valuation Report for This Property
The Home Valuation Report is an in-depth analysis detailing your home's value as well as a comparison with similar homes in the area
Home Values in the Area
Average Home Value in this Area
Purchase History
| Date | Buyer | Sale Price | Title Company |
|---|---|---|---|
| Collazo William - | $99,000 | -- | |
| Driscoll Keith E | $137,000 | -- | |
| Hatch Marsha J | $80,000 | -- |
Source: Public Records
Mortgage History
| Date | Status | Borrower | Loan Amount |
|---|---|---|---|
| Open | Hatch Marsha J | $96,490 | |
| Previous Owner | Hatch Marsha J | $184,500 | |
| Previous Owner | Hatch Marsha J | $180,500 | |
| Previous Owner | Hatch Marsha J | $123,300 |
Source: Public Records
Tax History Compared to Growth
Tax History
| Year | Tax Paid | Tax Assessment Tax Assessment Total Assessment is a certain percentage of the fair market value that is determined by local assessors to be the total taxable value of land and additions on the property. | Land | Improvement |
|---|---|---|---|---|
| 2025 | $2,853 | $339,600 | $118,800 | $220,800 |
| 2024 | $5,259 | $286,600 | $75,300 | $211,300 |
| 2023 | $5,259 | $286,600 | $75,300 | $211,300 |
| 2022 | $5,101 | $286,600 | $75,300 | $211,300 |
| 2021 | $4,224 | $172,000 | $33,200 | $138,800 |
| 2020 | $4,224 | $172,000 | $33,200 | $138,800 |
| 2019 | $4,224 | $172,000 | $33,200 | $138,800 |
| 2018 | $3,317 | $103,800 | $30,200 | $73,600 |
| 2017 | $3,317 | $103,800 | $30,200 | $73,600 |
| 2016 | $3,317 | $103,800 | $30,200 | $73,600 |
| 2015 | $3,336 | $100,800 | $30,200 | $70,600 |
| 2014 | $3,402 | $100,800 | $30,200 | $70,600 |
| 2013 | $3,402 | $100,800 | $30,200 | $70,600 |
Source: Public Records
Map
Nearby Homes