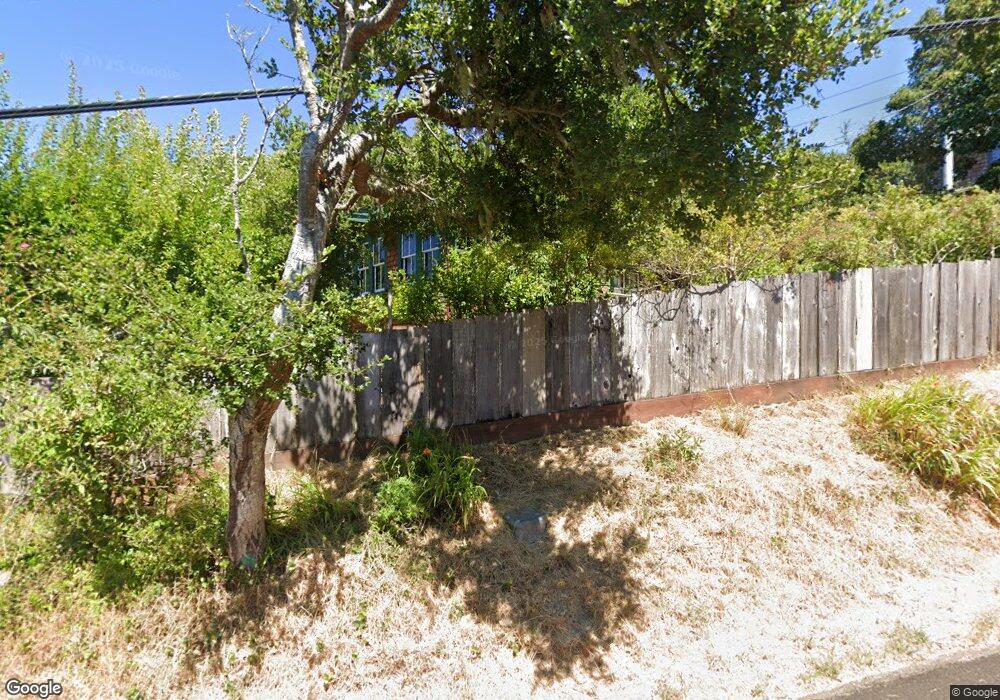
33 Callendar Way Inverness, CA 94937
Estimated Value: $883,000 - $1,256,000
1
Bed
1
Bath
792
Sq Ft
$1,297/Sq Ft
Est. Value
About This Home
This home is located at 33 Callendar Way, Inverness, CA 94937 and is currently estimated at $1,027,272, approximately $1,297 per square foot. 33 Callendar Way is a home located in Marin County with nearby schools including West Marin Elementary School and Tomales High School.
Ownership History
Date
Name
Owned For
Owner Type
Purchase Details
Closed on
Nov 10, 2011
Sold by
Duncan Timothy B and Duncan Lael C
Bought by
Darley Mark C and Darley Suzanne L
Current Estimated Value
Purchase Details
Closed on
May 8, 2009
Sold by
Duncan Timothy B and Duncan Lael C
Bought by
Duncan Timothy B and Duncan Lael C
Home Financials for this Owner
Home Financials are based on the most recent Mortgage that was taken out on this home.
Original Mortgage
$315,000
Interest Rate
4.8%
Mortgage Type
New Conventional
Purchase Details
Closed on
Jun 12, 2008
Sold by
Beyer Elizabeth
Bought by
Duncan Timothy B and Duncan Lael C
Home Financials for this Owner
Home Financials are based on the most recent Mortgage that was taken out on this home.
Original Mortgage
$325,000
Interest Rate
5.5%
Mortgage Type
Purchase Money Mortgage
Purchase Details
Closed on
Mar 17, 1994
Sold by
Beyer Elizabeth
Bought by
Beyer Elizabeth
Create a Home Valuation Report for This Property
The Home Valuation Report is an in-depth analysis detailing your home's value as well as a comparison with similar homes in the area
Home Values in the Area
Average Home Value in this Area
Purchase History
| Date | Buyer | Sale Price | Title Company |
|---|---|---|---|
| Darley Mark C | $457,000 | First American Title Company | |
| Duncan Timothy B | -- | First American Title Company | |
| Duncan Timothy B | $525,000 | California Land Title Marin | |
| Beyer Elizabeth | -- | -- | |
| Beyer Elizabeth | -- | -- |
Source: Public Records
Mortgage History
| Date | Status | Borrower | Loan Amount |
|---|---|---|---|
| Previous Owner | Duncan Timothy B | $315,000 | |
| Previous Owner | Duncan Timothy B | $325,000 |
Source: Public Records
Tax History
| Year | Tax Paid | Tax Assessment Tax Assessment Total Assessment is a certain percentage of the fair market value that is determined by local assessors to be the total taxable value of land and additions on the property. | Land | Improvement |
|---|---|---|---|---|
| 2025 | $6,748 | $573,987 | $376,797 | $197,190 |
| 2024 | $6,698 | $562,736 | $369,411 | $193,325 |
| 2023 | $6,553 | $551,704 | $362,169 | $189,535 |
| 2022 | $6,483 | $540,886 | $355,068 | $185,818 |
| 2021 | $6,349 | $530,284 | $348,108 | $182,176 |
| 2020 | $6,347 | $524,850 | $344,541 | $180,309 |
| 2019 | $6,167 | $514,563 | $337,788 | $176,775 |
| 2018 | $6,041 | $504,477 | $331,167 | $173,310 |
| 2017 | $5,892 | $494,588 | $324,675 | $169,913 |
| 2016 | $5,632 | $484,890 | $318,309 | $166,581 |
| 2015 | $5,623 | $477,610 | $313,530 | $164,080 |
| 2014 | $5,422 | $468,255 | $307,389 | $160,866 |
Source: Public Records
Map
Nearby Homes
- 95 Highland Way
- 55 Highland Way
- 10 Miwok Way
- 0 Drake Way
- 531 Via de la Vista
- 20 Redwood Ave
- 0 W Robert Dr
- 0 Douglas Dr
- 140 Buena Vista Ave
- 1208 Pierce Point Rd
- 18 Cypress Rd
- 7 Linsdale Ln
- 9 Portola Ave
- 700 B St
- 10905 State Route 1
- 70 Fox Dr
- 6381 Nicasio Valley Rd
- 58 Red Barn Ct
- 22 Red Barn Ct
- 50&52 Red Barn Ct
- 29 Callendar Way
- 45 Callender Way
- 65 Callendar Way
- 25 Callendar Way
- 72 Park Ave
- 51 Callendar Way
- 60 Callendar Way
- 50 Callendar Way
- 70 Callendar Way
- 40 Callendar Way
- 30 Callendar Way
- 131 Aberdeen Way
- 50 Dundee Way
- 10 Elgin Way
- 50 Elgin Way
- 57 Argyle St
- 46 Callendar Way
- 8 Cameron St
- 95 Balmoral St
- 16 Cameron St
Your Personal Tour Guide
Ask me questions while you tour the home.