Estimated Value: $1,098,000 - $1,273,000
5
Beds
6
Baths
4,308
Sq Ft
$267/Sq Ft
Est. Value
About This Home
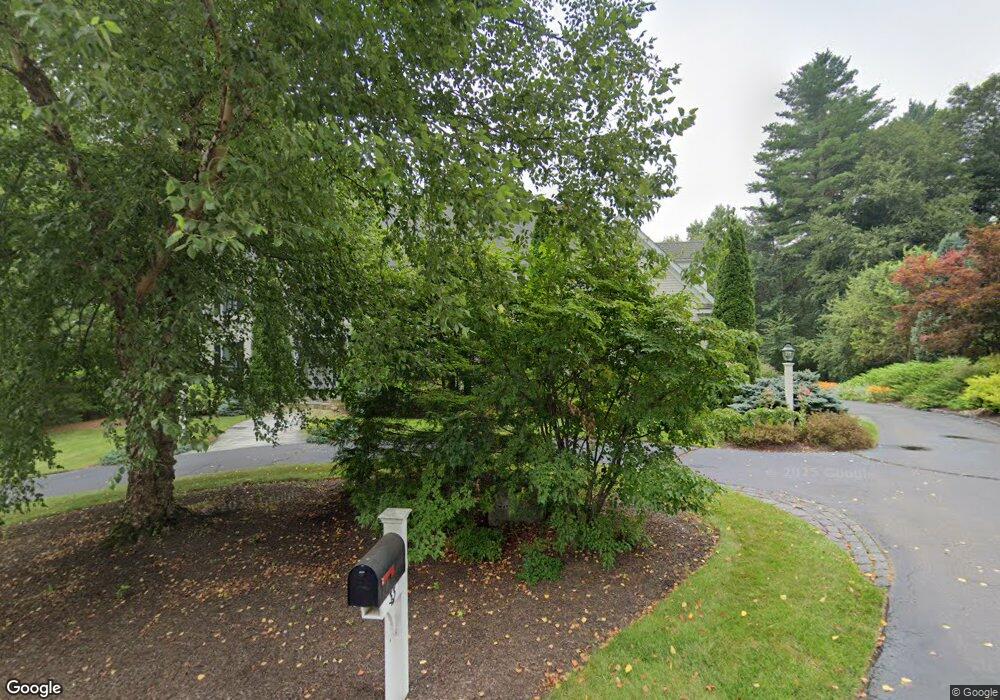
This home is located at 33 Cambridge Crossing, Avon, CT 06001 and is currently estimated at $1,150,877, approximately $267 per square foot. 33 Cambridge Crossing is a home located in Hartford County with nearby schools including Roaring Brook School, Thompson Brook School, and Avon Middle School.
Ownership History
Date
Name
Owned For
Owner Type
Purchase Details
Closed on
Aug 3, 2012
Sold by
Fischler Ft and Fischler
Bought by
Fischler Adam H and Fischler
Current Estimated Value
Home Financials for this Owner
Home Financials are based on the most recent Mortgage that was taken out on this home.
Original Mortgage
$0
Interest Rate
2.83%
Mortgage Type
New Conventional
Purchase Details
Closed on
Jun 3, 2011
Sold by
Fischler Adam H and Fischler
Bought by
Fischler Family Ret and Fischler
Home Financials for this Owner
Home Financials are based on the most recent Mortgage that was taken out on this home.
Original Mortgage
$0
Interest Rate
4.55%
Mortgage Type
Stand Alone Second
Purchase Details
Closed on
Nov 19, 2009
Sold by
Fischler Adam H
Bought by
Fischler Adam H and Fischler Barbara B
Purchase Details
Closed on
Jan 13, 2003
Sold by
Sunlight Const Inc
Bought by
Fischler Adam H and Fischler Barbara B
Home Financials for this Owner
Home Financials are based on the most recent Mortgage that was taken out on this home.
Original Mortgage
$580,000
Interest Rate
6.19%
Create a Home Valuation Report for This Property
The Home Valuation Report is an in-depth analysis detailing your home's value as well as a comparison with similar homes in the area
Home Values in the Area
Average Home Value in this Area
Purchase History
| Date | Buyer | Sale Price | Title Company |
|---|---|---|---|
| Fischler Adam H | -- | -- | |
| Fischler Adam H | -- | -- | |
| Fischler Family Ret | -- | -- | |
| Fischler Family Ret | -- | -- | |
| Fischler Adam H | -- | -- | |
| Fischler Adam H | -- | -- | |
| Fischler Adam H | -- | -- | |
| Fischler Adam H | $728,696 | -- | |
| Fischler Adam H | $728,696 | -- |
Source: Public Records
Mortgage History
| Date | Status | Borrower | Loan Amount |
|---|---|---|---|
| Closed | Fischler Adam H | $0 | |
| Previous Owner | Fischler Adam H | $0 | |
| Previous Owner | Fischler Adam H | $580,000 |
Source: Public Records
Tax History Compared to Growth
Tax History
| Year | Tax Paid | Tax Assessment Tax Assessment Total Assessment is a certain percentage of the fair market value that is determined by local assessors to be the total taxable value of land and additions on the property. | Land | Improvement |
|---|---|---|---|---|
| 2025 | $19,198 | $624,340 | $122,770 | $501,570 |
| 2024 | $18,518 | $624,340 | $122,770 | $501,570 |
| 2023 | $19,035 | $537,870 | $140,270 | $397,600 |
| 2022 | $18,564 | $537,870 | $140,270 | $397,600 |
| 2021 | $18,401 | $537,870 | $140,270 | $397,600 |
| 2020 | $17,696 | $537,870 | $140,270 | $397,600 |
| 2019 | $17,696 | $537,870 | $140,270 | $397,600 |
| 2018 | $17,054 | $543,980 | $140,270 | $403,710 |
| 2017 | $16,640 | $543,980 | $140,270 | $403,710 |
| 2016 | $16,058 | $543,980 | $140,270 | $403,710 |
| 2015 | $15,667 | $543,980 | $140,270 | $403,710 |
| 2014 | $15,406 | $543,980 | $140,270 | $403,710 |
Source: Public Records
Map
Nearby Homes
- 189 W Avon Rd
- 185 W Avon Rd
- 35 Burnham Rd
- 26 Ridgewood Rd
- 60 Hollister Dr
- 4 Tanglewood Dr
- 11 Hollister Dr
- 81 Bronson Rd
- 143 Juniper Dr
- 187 W Avon Rd
- 114 Cold Spring Rd
- 102 Country Club Rd
- 68 Scoville Rd
- 30 Cliff Dr
- 51 Charing Cross
- 16 Chevas Rd
- 7 Woodmont Rd
- 455 Lovely St
- 5 Homestead Ln
- 2 Highland Square
- 47 Cambridge Crossing
- 104 Cambridge Crossing
- 27 Cambridge Crossing
- 356 Country Club Rd
- 32 Cambridge Crossing
- 358 Country Club Rd
- 36 Cambridge Crossing
- 23 Cambridge Crossing
- 37 Cambridge Crossing
- 24 Cambridge Crossing
- 376 Country Club Rd
- 360 Country Club Rd
- 19 Cambridge Crossing
- 24 Paper Chase Trail
- 18 Paper Chase Trail
- 14 Cambridge Crossing
- 30 Paper Chase Trail
- 15 Cambridge Crossing
- 390 Country Club Rd
- 10 Paper Chase Trail