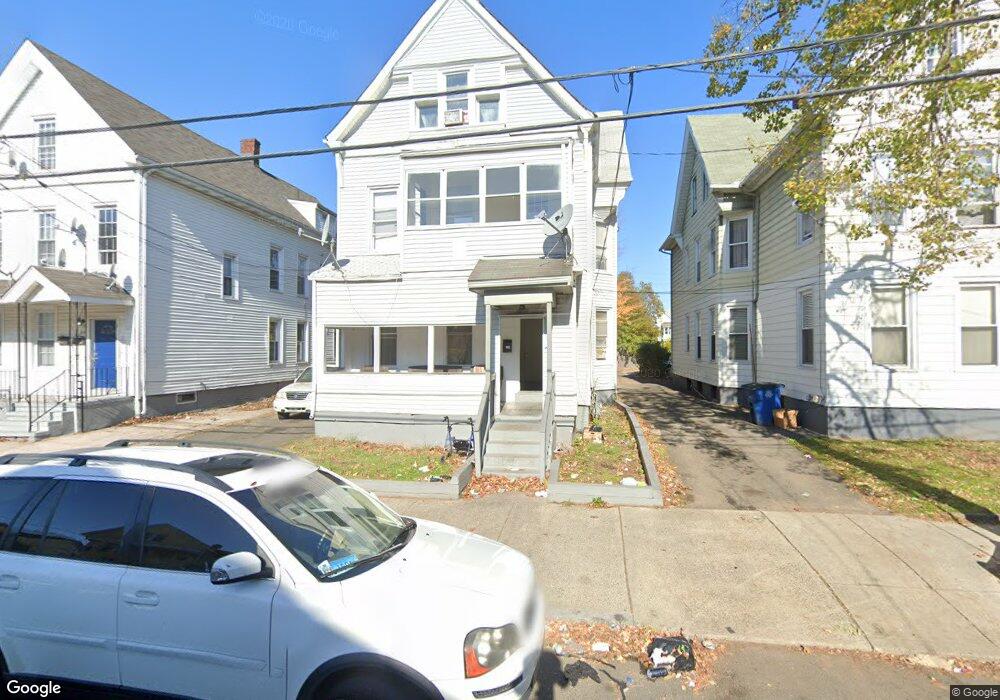
33 Cassius St New Haven, CT 06519
The Hill NeighborhoodEstimated Value: $287,792 - $447,000
5
Beds
2
Baths
1,879
Sq Ft
$197/Sq Ft
Est. Value
About This Home
This home is located at 33 Cassius St, New Haven, CT 06519 and is currently estimated at $369,948, approximately $196 per square foot. 33 Cassius St is a home located in New Haven County with nearby schools including John C. Daniels and St Martin De Porres Academy.
Ownership History
Date
Name
Owned For
Owner Type
Purchase Details
Closed on
Jun 20, 2017
Sold by
Barney Boy Llc
Bought by
Stewie 1 Llc
Current Estimated Value
Purchase Details
Closed on
Jul 15, 2013
Sold by
210 Burwell Avenue Llc
Bought by
Barney Boy Llc
Purchase Details
Closed on
Jan 19, 2011
Sold by
Steinbach Michael
Bought by
210 Burwell Avenue Llc
Purchase Details
Closed on
May 13, 2002
Sold by
Citifinancial Mtg Co
Bought by
Constitution Hldng Llc
Purchase Details
Closed on
Apr 18, 1996
Sold by
Bradley James O and Bradley Janie M
Bought by
Perry Ronald and Ulmer Beverley
Create a Home Valuation Report for This Property
The Home Valuation Report is an in-depth analysis detailing your home's value as well as a comparison with similar homes in the area
Home Values in the Area
Average Home Value in this Area
Purchase History
| Date | Buyer | Sale Price | Title Company |
|---|---|---|---|
| Stewie 1 Llc | -- | -- | |
| Barney Boy Llc | -- | -- | |
| 210 Burwell Avenue Llc | -- | -- | |
| Constitution Hldng Llc | $50,000 | -- | |
| Perry Ronald | $30,000 | -- |
Source: Public Records
Mortgage History
| Date | Status | Borrower | Loan Amount |
|---|---|---|---|
| Previous Owner | Perry Ronald | $150,000 | |
| Previous Owner | Perry Ronald | $156,000 |
Source: Public Records
Tax History Compared to Growth
Tax History
| Year | Tax Paid | Tax Assessment Tax Assessment Total Assessment is a certain percentage of the fair market value that is determined by local assessors to be the total taxable value of land and additions on the property. | Land | Improvement |
|---|---|---|---|---|
| 2025 | $5,268 | $133,700 | $21,560 | $112,140 |
| 2024 | $5,147 | $133,700 | $21,560 | $112,140 |
| 2023 | $4,974 | $133,700 | $21,560 | $112,140 |
| 2022 | $5,315 | $133,700 | $21,560 | $112,140 |
| 2021 | $3,394 | $77,350 | $18,550 | $58,800 |
| 2020 | $3,394 | $77,350 | $18,550 | $58,800 |
| 2019 | $3,325 | $77,350 | $18,550 | $58,800 |
| 2018 | $3,325 | $77,350 | $18,550 | $58,800 |
| 2017 | $2,992 | $77,350 | $18,550 | $58,800 |
| 2016 | $2,501 | $60,200 | $10,570 | $49,630 |
| 2015 | $2,501 | $60,200 | $10,570 | $49,630 |
| 2014 | $2,501 | $60,200 | $10,570 | $49,630 |
Source: Public Records
Map
Nearby Homes
- 29 Cassius St
- 38 Cassius St
- 28 Cassius St Unit 1
- 25 Cassius St
- 24 Cassius St
- 407 Howard Ave
- 19 Cassius St
- 399 Howard Ave
- 399 Howard Ave Unit 2R
- 20 Cassius St
- 395 Howard Ave
- 15 Cassius St
- 391 Howard Ave
- 18 Cassius St
- 11 Cassius St
- 387 Howard Ave
- 16 Cassius St
- 29 Lamberton St
- 23 Lamberton St
- 425 Howard Ave