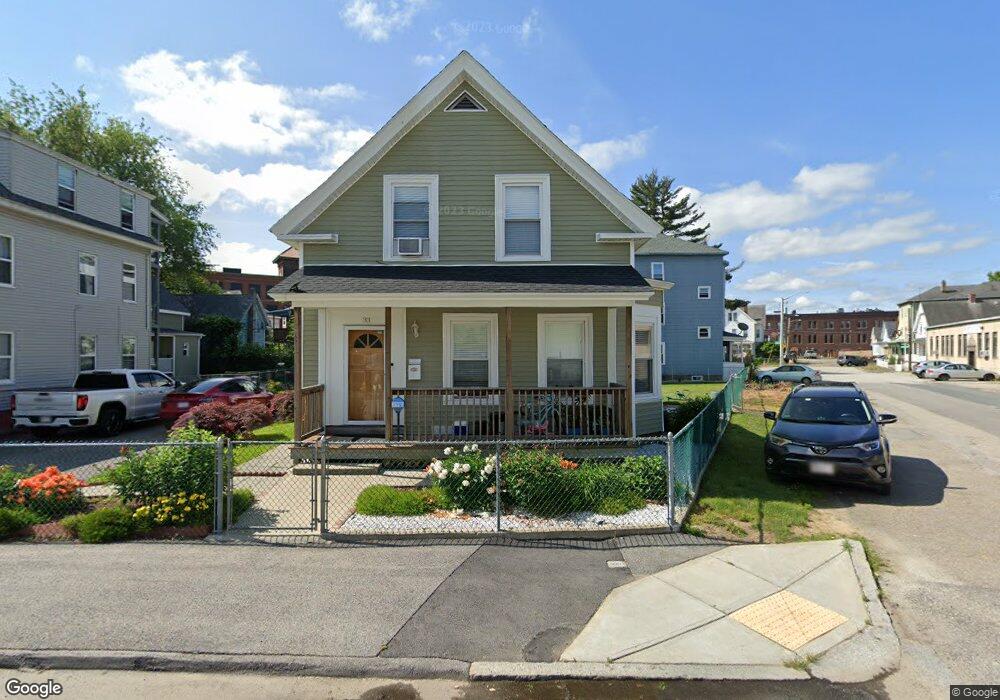
33 Cheever St Worcester, MA 01610
South Worcester NeighborhoodEstimated Value: $329,000 - $384,000
3
Beds
1
Bath
1,253
Sq Ft
$281/Sq Ft
Est. Value
About This Home
This home is located at 33 Cheever St, Worcester, MA 01610 and is currently estimated at $352,660, approximately $281 per square foot. 33 Cheever St is a home located in Worcester County with nearby schools including Jacob Hiatt Magnet School, Chandler Magnet, and University Park Campus School.
Ownership History
Date
Name
Owned For
Owner Type
Purchase Details
Closed on
Jan 22, 2014
Sold by
Deutsche Bk Natl T Co
Bought by
Tran My Y
Current Estimated Value
Purchase Details
Closed on
Aug 19, 2013
Sold by
Rivera Joseph
Bought by
Deutsche Bk Natl T Co
Purchase Details
Closed on
Mar 10, 2006
Sold by
Palos Alice and Palos Billy R
Bought by
Rivera Joseph and Martinez Sylvia I
Home Financials for this Owner
Home Financials are based on the most recent Mortgage that was taken out on this home.
Original Mortgage
$126,000
Interest Rate
6.15%
Mortgage Type
Purchase Money Mortgage
Purchase Details
Closed on
Aug 11, 2000
Sold by
Mcclune George W
Bought by
Palos Billy R
Home Financials for this Owner
Home Financials are based on the most recent Mortgage that was taken out on this home.
Original Mortgage
$92,452
Interest Rate
8.21%
Mortgage Type
Purchase Money Mortgage
Create a Home Valuation Report for This Property
The Home Valuation Report is an in-depth analysis detailing your home's value as well as a comparison with similar homes in the area
Home Values in the Area
Average Home Value in this Area
Purchase History
| Date | Buyer | Sale Price | Title Company |
|---|---|---|---|
| Tran My Y | $69,000 | -- | |
| Deutsche Bk Natl T Co | $52,800 | -- | |
| Rivera Joseph | $157,500 | -- | |
| Palos Billy R | $92,500 | -- |
Source: Public Records
Mortgage History
| Date | Status | Borrower | Loan Amount |
|---|---|---|---|
| Previous Owner | Rivera Joseph | $126,000 | |
| Previous Owner | Palos Billy R | $121,735 | |
| Previous Owner | Palos Billy R | $92,451 | |
| Previous Owner | Palos Billy R | $92,452 |
Source: Public Records
Tax History
| Year | Tax Paid | Tax Assessment Tax Assessment Total Assessment is a certain percentage of the fair market value that is determined by local assessors to be the total taxable value of land and additions on the property. | Land | Improvement |
|---|---|---|---|---|
| 2025 | $3,465 | $262,700 | $97,800 | $164,900 |
| 2024 | $3,347 | $243,400 | $97,800 | $145,600 |
| 2023 | $3,195 | $222,800 | $85,100 | $137,700 |
| 2022 | $2,917 | $191,800 | $68,100 | $123,700 |
| 2021 | $2,733 | $167,900 | $54,400 | $113,500 |
| 2020 | $2,620 | $154,100 | $54,100 | $100,000 |
| 2019 | $2,488 | $138,200 | $47,200 | $91,000 |
| 2018 | $2,494 | $131,900 | $47,200 | $84,700 |
| 2017 | $2,401 | $124,900 | $47,200 | $77,700 |
| 2016 | $2,304 | $111,800 | $33,400 | $78,400 |
| 2015 | $2,244 | $111,800 | $33,400 | $78,400 |
| 2014 | $2,185 | $111,800 | $33,400 | $78,400 |
Source: Public Records
Map
Nearby Homes
- 20 Washburn St
- 607 Cambridge St Unit 4
- 103 Illinois St
- 52 Richards St
- 15 Gardner St
- 56 Richards St
- 54 Richards St
- 18 Crystal St
- 28 Richards St
- 200 Beacon St
- 14 Hancock St
- 7 Wyman St
- 5 Ripley Place
- 3A Gediminas St
- 172 Perry Ave Unit 1A
- 172 Perry Ave Unit 2B
- 5 Freeland Terrace
- 26 Maxwell St
- 12 Stoneland Rd
- 5 Stoneland Rd
- 23 Cheever St
- 23 Cheever St Unit 3
- 21 Woodward St
- 26 Crompton St
- 24 Crompton St
- 21 Cheever St
- 28 Crompton St
- 22 Crompton St
- 22 Crompton St Unit 3
- 22 Crompton St Unit 2
- 11 Woodward St
- 19 Cheever St
- 17 Cheever St
- 27 Crompton St
- 25 1/2 Crompton St
- 29 Crompton St
- 25 Crompton St
- 26 Woodward St
- 23 Crompton St
- 23 Crompton St Unit 1
Your Personal Tour Guide
Ask me questions while you tour the home.