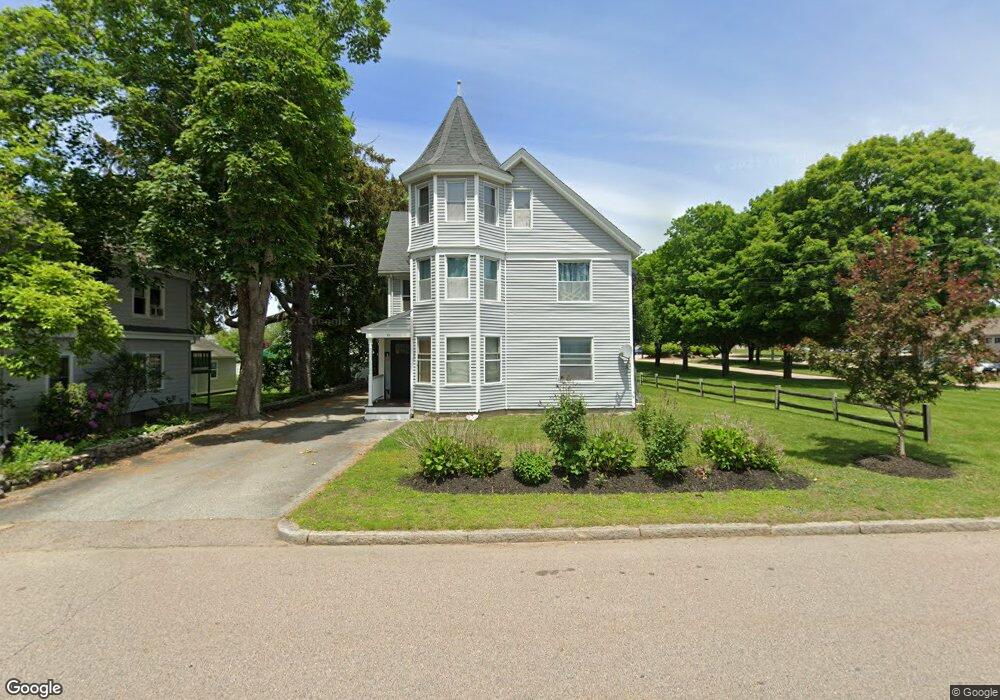
33 Clark St Westerly, RI 02891
Estimated Value: $498,000 - $651,000
5
Beds
2
Baths
2,616
Sq Ft
$219/Sq Ft
Est. Value
About This Home
This home is located at 33 Clark St, Westerly, RI 02891 and is currently estimated at $571,633, approximately $218 per square foot. 33 Clark St is a home located in Washington County with nearby schools including Westerly High School and St. Michael School.
Ownership History
Date
Name
Owned For
Owner Type
Purchase Details
Closed on
Oct 31, 2003
Sold by
Williams Paul and Williams Dorie
Bought by
Brennan Timothy and Brennan Jill
Current Estimated Value
Home Financials for this Owner
Home Financials are based on the most recent Mortgage that was taken out on this home.
Original Mortgage
$216,000
Interest Rate
6.05%
Purchase Details
Closed on
Jun 2, 1998
Sold by
Brunelle Ronald E
Bought by
Williams Paul J and Williams Dorie J
Create a Home Valuation Report for This Property
The Home Valuation Report is an in-depth analysis detailing your home's value as well as a comparison with similar homes in the area
Home Values in the Area
Average Home Value in this Area
Purchase History
We collect this data history from publicly available records. To have your information removed, we recommend requesting removal directly through your county’s website.
| Date | Buyer | Sale Price | Title Company |
|---|---|---|---|
| Brennan Timothy | $240,000 | -- | |
| Williams Paul J | $110,000 | -- |
Source: Public Records
Mortgage History
We collect this data history from publicly available records. To have your information removed, we recommend requesting removal directly through your county’s website.
| Date | Status | Borrower | Loan Amount |
|---|---|---|---|
| Open | Williams Paul J | $231,500 | |
| Closed | Williams Paul J | $254,201 | |
| Closed | Williams Paul J | $216,000 | |
| Previous Owner | Williams Paul J | $120,649 |
Source: Public Records
Tax History
| Year | Tax Paid | Tax Assessment Tax Assessment Total Assessment is a certain percentage of the fair market value that is determined by local assessors to be the total taxable value of land and additions on the property. | Land | Improvement |
|---|---|---|---|---|
| 2025 | $3,310 | $425,500 | $152,300 | $273,200 |
| 2024 | $3,459 | $331,000 | $108,900 | $222,100 |
| 2023 | $3,363 | $331,000 | $108,900 | $222,100 |
| 2022 | $3,343 | $331,000 | $108,900 | $222,100 |
| 2021 | $3,437 | $285,000 | $94,800 | $190,200 |
| 2020 | $3,316 | $279,800 | $94,800 | $185,000 |
| 2019 | $3,285 | $279,800 | $94,800 | $185,000 |
| 2018 | $3,081 | $249,500 | $94,800 | $154,700 |
| 2017 | $2,994 | $249,500 | $94,800 | $154,700 |
| 2016 | $2,994 | $249,500 | $94,800 | $154,700 |
| 2015 | $2,874 | $255,900 | $96,700 | $159,200 |
| 2014 | $2,828 | $255,900 | $96,700 | $159,200 |
Source: Public Records
Map
Nearby Homes
- 70 Margin St
- 42 Westminster St
- 23 Abbey Ln Unit 12
- 24 Abbey Ln Unit 13
- 21 North Dr
- 52 Moss St
- 26 Field St
- 37 William St
- 25 School St Unit 2
- 27 School St Unit 1
- 14 George St
- 38 School St
- 13 Moss St
- 21 Chase St
- 15 Blue Heron Dr
- 124 W Broad St
- 174 River Rd
- 51 Pequot Trail
- 38 Summertime Cir
- 32 Summertime Cir
Your Personal Tour Guide
Ask me questions while you tour the home.