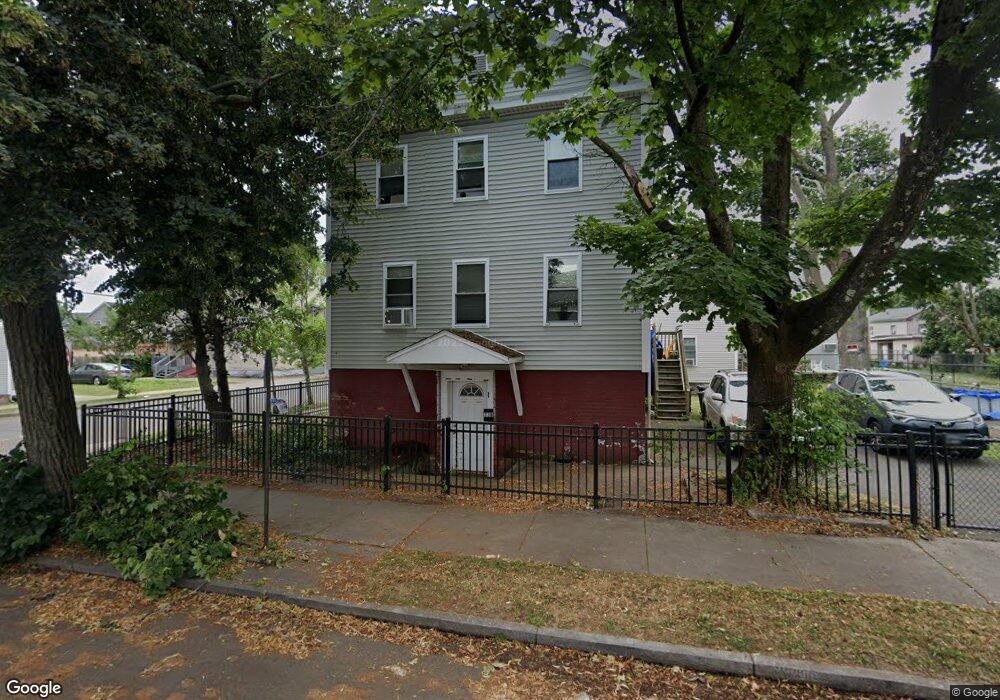
33 Clay St New Haven, CT 06513
Fair Haven NeighborhoodEstimated Value: $300,000 - $321,000
4
Beds
2
Baths
1,728
Sq Ft
$181/Sq Ft
Est. Value
About This Home
This home is located at 33 Clay St, New Haven, CT 06513 and is currently estimated at $312,333, approximately $180 per square foot. 33 Clay St is a home located in New Haven County with nearby schools including Clinton Avenue School, Elm City College Preparatory School, and Cold Spring School.
Ownership History
Date
Name
Owned For
Owner Type
Purchase Details
Closed on
Nov 13, 2006
Sold by
Ze Llc
Bought by
Mutual Hsng Assn Conn
Current Estimated Value
Purchase Details
Closed on
Jun 22, 2004
Sold by
J&J Property Svc Llc
Bought by
Zhubrak Edward
Purchase Details
Closed on
Oct 8, 2003
Sold by
J&E Inv Co Llc
Bought by
J&J Prop Svc Llc
Purchase Details
Closed on
Jan 2, 2002
Sold by
Eastern Trust Llc
Bought by
Robbins Leonard
Purchase Details
Closed on
Jul 31, 1997
Sold by
Mascola James
Bought by
Pomerantz Joan
Create a Home Valuation Report for This Property
The Home Valuation Report is an in-depth analysis detailing your home's value as well as a comparison with similar homes in the area
Home Values in the Area
Average Home Value in this Area
Purchase History
| Date | Buyer | Sale Price | Title Company |
|---|---|---|---|
| Mutual Hsng Assn Conn | $210,000 | -- | |
| Zhubrak Edward | $165,000 | -- | |
| J&J Prop Svc Llc | $110,000 | -- | |
| Robbins Leonard | $40,000 | -- | |
| Eastern Trust Llc | $35,000 | -- | |
| Pomerantz Joan | $30,000 | -- |
Source: Public Records
Mortgage History
| Date | Status | Borrower | Loan Amount |
|---|---|---|---|
| Open | Pomerantz Joan | $469,000 | |
| Closed | Pomerantz Joan | $200,000 |
Source: Public Records
Tax History
| Year | Tax Paid | Tax Assessment Tax Assessment Total Assessment is a certain percentage of the fair market value that is determined by local assessors to be the total taxable value of land and additions on the property. | Land | Improvement |
|---|---|---|---|---|
| 2025 | $3,448 | $87,500 | $26,040 | $61,460 |
| 2024 | $3,369 | $87,500 | $26,040 | $61,460 |
| 2023 | $5,750 | $154,560 | $26,040 | $128,520 |
| 2022 | $6,144 | $154,560 | $26,040 | $128,520 |
| 2021 | $1,891 | $43,103 | $20,790 | $22,313 |
| 2020 | $1,891 | $43,103 | $20,790 | $22,313 |
| 2019 | $1,853 | $43,103 | $20,790 | $22,313 |
| 2018 | $1,853 | $43,103 | $20,790 | $22,313 |
| 2017 | $3,273 | $84,630 | $20,790 | $63,840 |
| 2016 | $2,663 | $64,086 | $13,860 | $50,226 |
| 2015 | $2,663 | $64,086 | $13,860 | $50,226 |
| 2014 | $2,821 | $67,900 | $13,860 | $54,040 |
Source: Public Records
Map
Nearby Homes
- 369 Poplar St
- 121 Fillmore St
- 409 Poplar St
- 373 Blatchley Ave
- 444 Poplar St
- 30 Monroe St
- 111 Pine St
- 56 Woolsey St
- 265 James St
- 383 Lombard St Unit 383
- 73 Main St
- 95 Haven St
- 72 Pierpont St
- 181 James St
- 169 James St
- 35 Saltonstall Ave
- 127 James St
- 191 Ferry St
- 114 Blatchley Ave
- 100 Front St Unit 100
Your Personal Tour Guide
Ask me questions while you tour the home.