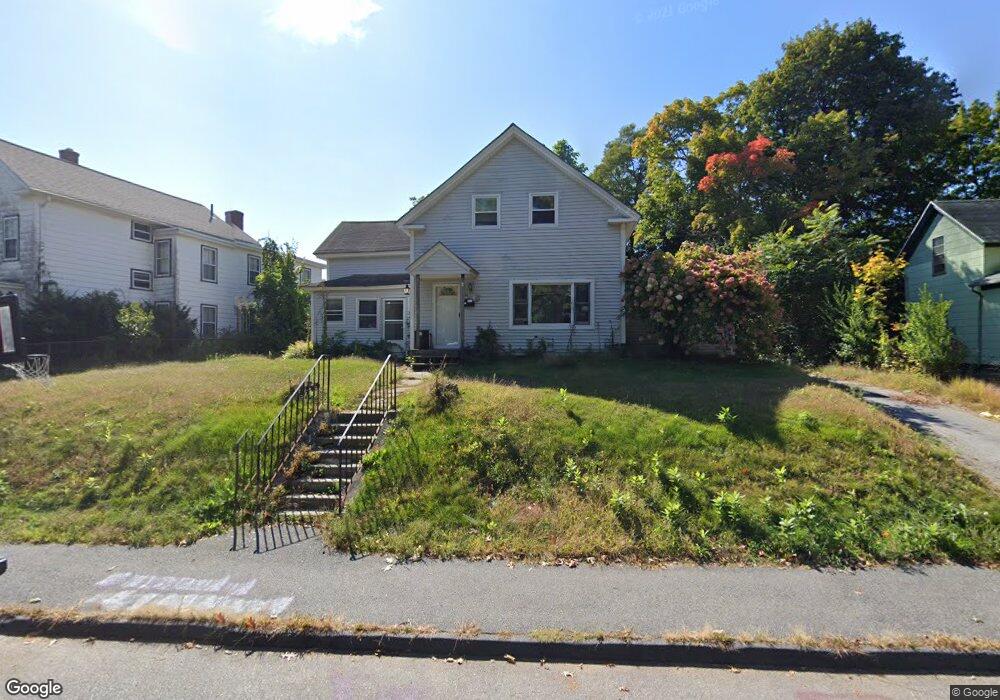
33 Coes St Worcester, MA 01603
Webster Square NeighborhoodEstimated Value: $353,000 - $422,000
3
Beds
2
Baths
1,512
Sq Ft
$265/Sq Ft
Est. Value
About This Home
This home is located at 33 Coes St, Worcester, MA 01603 and is currently estimated at $400,964, approximately $265 per square foot. 33 Coes St is a home located in Worcester County with nearby schools including Columbus Park Preparatory Academy, Jacob Hiatt Magnet School, and Chandler Magnet.
Ownership History
Date
Name
Owned For
Owner Type
Purchase Details
Closed on
Nov 1, 2011
Sold by
Department Of Housing & Urban Dev
Bought by
Tn Props Llc
Current Estimated Value
Home Financials for this Owner
Home Financials are based on the most recent Mortgage that was taken out on this home.
Original Mortgage
$61,875
Outstanding Balance
$42,376
Interest Rate
4.11%
Mortgage Type
Purchase Money Mortgage
Estimated Equity
$358,588
Purchase Details
Closed on
May 27, 2011
Sold by
Citimortgage Inc
Bought by
Department Of Housing & Urban Dev
Purchase Details
Closed on
Sep 17, 2010
Sold by
Parks Stephanie M
Bought by
Citimortgage Inc
Create a Home Valuation Report for This Property
The Home Valuation Report is an in-depth analysis detailing your home's value as well as a comparison with similar homes in the area
Home Values in the Area
Average Home Value in this Area
Purchase History
| Date | Buyer | Sale Price | Title Company |
|---|---|---|---|
| Tn Props Llc | $82,500 | -- | |
| Department Of Housing & Urban Dev | -- | -- | |
| Citimortgage Inc | $277,115 | -- |
Source: Public Records
Mortgage History
| Date | Status | Borrower | Loan Amount |
|---|---|---|---|
| Open | Tn Props Llc | $61,875 |
Source: Public Records
Tax History
| Year | Tax Paid | Tax Assessment Tax Assessment Total Assessment is a certain percentage of the fair market value that is determined by local assessors to be the total taxable value of land and additions on the property. | Land | Improvement |
|---|---|---|---|---|
| 2025 | $4,545 | $344,600 | $98,600 | $246,000 |
| 2024 | $4,344 | $315,900 | $98,600 | $217,300 |
| 2023 | $4,176 | $291,200 | $85,700 | $205,500 |
| 2022 | $3,851 | $253,200 | $68,600 | $184,600 |
| 2021 | $3,811 | $234,100 | $54,900 | $179,200 |
| 2020 | $3,609 | $212,300 | $54,500 | $157,800 |
| 2019 | $3,442 | $191,200 | $47,600 | $143,600 |
| 2018 | $3,428 | $181,300 | $47,600 | $133,700 |
| 2017 | $3,273 | $170,300 | $47,600 | $122,700 |
| 2016 | $3,254 | $157,900 | $34,100 | $123,800 |
| 2015 | $3,169 | $157,900 | $34,100 | $123,800 |
| 2014 | $3,085 | $157,900 | $34,100 | $123,800 |
Source: Public Records
Map
Nearby Homes
- 23 Lakewood St
- 152 Beaverbrook Pkwy
- 10 Lucian St
- 27 Montague St
- 37 Gates Rd
- 19 Woodbine St
- 19 Oliver St
- 2 Montague St
- 114 Lovell St
- 5 Stoneland Rd
- 31 B Gates Rd Unit 22R
- 12 Stoneland Rd
- 5 Freeland Terrace
- 215 Mill St Unit 113
- 215 Mill St Unit 115
- 10 Minthorne St
- 28 Richards St
- 18 Crystal St
- 54 Richards St
- 56 Richards St
Your Personal Tour Guide
Ask me questions while you tour the home.