Estimated Value: $597,582 - $699,000
3
Beds
2
Baths
1,144
Sq Ft
$567/Sq Ft
Est. Value
About This Home
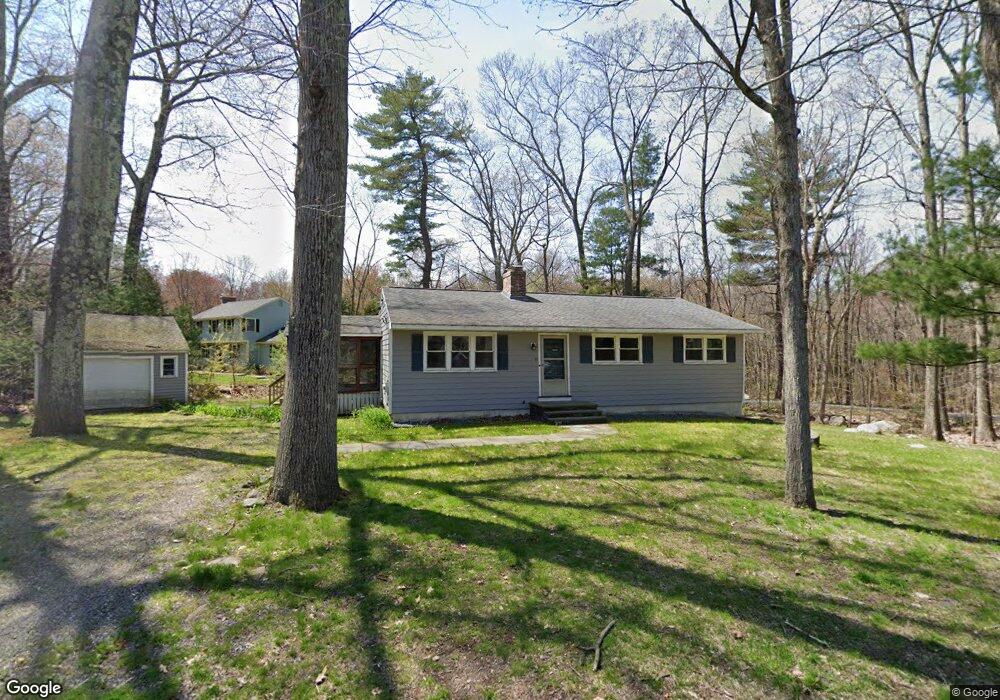
This home is located at 33 Conant St, Acton, MA 01720 and is currently estimated at $649,146, approximately $567 per square foot. 33 Conant St is a home located in Middlesex County with nearby schools including Acton-Boxborough Regional High School, Maynard Knowledge Beginnings, and The Imago School.
Ownership History
Date
Name
Owned For
Owner Type
Purchase Details
Closed on
Nov 1, 1994
Sold by
Sargent Robert B and Sargent Rosalie C
Bought by
Fitzgerald Deborah E
Current Estimated Value
Home Financials for this Owner
Home Financials are based on the most recent Mortgage that was taken out on this home.
Original Mortgage
$126,400
Interest Rate
8.65%
Mortgage Type
Purchase Money Mortgage
Create a Home Valuation Report for This Property
The Home Valuation Report is an in-depth analysis detailing your home's value as well as a comparison with similar homes in the area
Home Values in the Area
Average Home Value in this Area
Purchase History
| Date | Buyer | Sale Price | Title Company |
|---|---|---|---|
| Fitzgerald Deborah E | $158,000 | -- | |
| Fitzgerald Deborah E | $158,000 | -- |
Source: Public Records
Mortgage History
| Date | Status | Borrower | Loan Amount |
|---|---|---|---|
| Open | Fitzgerald Deborah E | $111,000 | |
| Closed | Fitzgerald Deborah E | $124,600 | |
| Closed | Fitzgerald Deborah E | $126,400 |
Source: Public Records
Tax History
| Year | Tax Paid | Tax Assessment Tax Assessment Total Assessment is a certain percentage of the fair market value that is determined by local assessors to be the total taxable value of land and additions on the property. | Land | Improvement |
|---|---|---|---|---|
| 2025 | $9,304 | $542,500 | $313,600 | $228,900 |
| 2024 | $8,850 | $530,900 | $313,600 | $217,300 |
| 2023 | $8,457 | $481,600 | $285,200 | $196,400 |
| 2022 | $8,373 | $430,500 | $248,000 | $182,500 |
| 2021 | $8,114 | $401,100 | $229,400 | $171,700 |
| 2020 | $7,625 | $396,300 | $229,400 | $166,900 |
| 2019 | $7,169 | $370,100 | $229,400 | $140,700 |
| 2018 | $6,781 | $349,900 | $229,400 | $120,500 |
| 2017 | $6,669 | $349,900 | $229,400 | $120,500 |
| 2016 | $6,384 | $332,000 | $229,400 | $102,600 |
| 2015 | $6,433 | $337,700 | $229,400 | $108,300 |
| 2014 | $6,457 | $332,000 | $229,400 | $102,600 |
Source: Public Records
Map
Nearby Homes
- 63 Conant St
- 30 Brewster Ln
- 40 High St
- 36 Brown St
- 1 Carlton Dr
- 70 River St
- 131 Main St
- 1 Vanderbelt Rd
- 1 Drummer Rd Unit A5
- 130 Parker St Unit J2
- 70 Powder Mill Rd
- 7 Hillcrest Dr
- 2 Wall Ct
- 6 Beacon Ct
- 182 Main St Unit 4
- 184 Main St Unit 3
- 6 Nancy Cir
- 153 Summer St
- 22 Douglas Ave Unit 2
- 22 Douglas Ave Unit 1
Your Personal Tour Guide
Ask me questions while you tour the home.