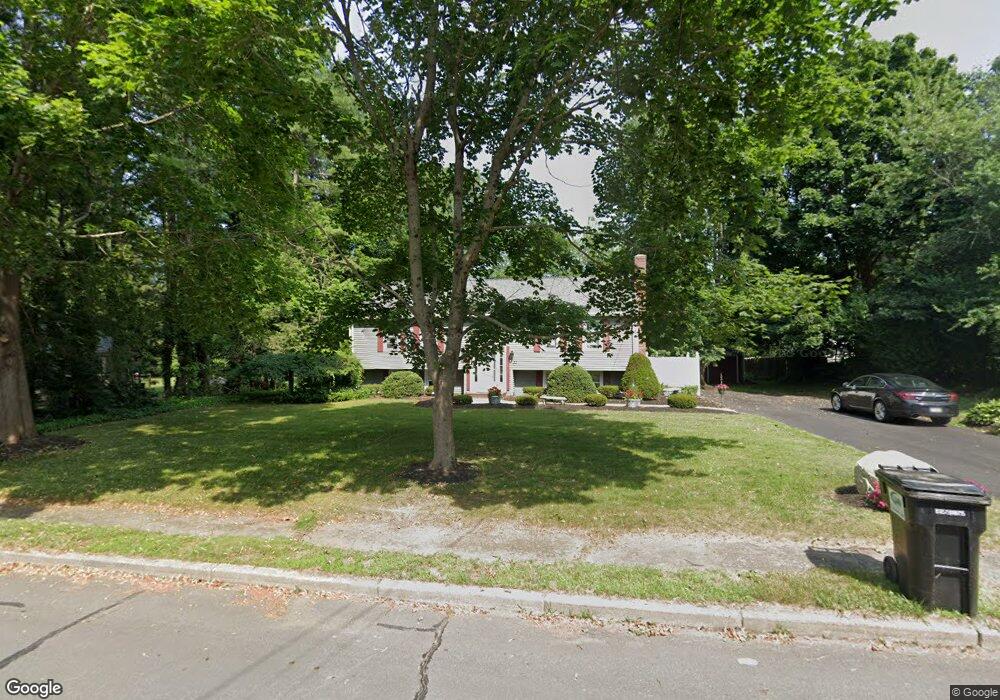
33 Crescent Dr Bridgewater, MA 02324
Estimated Value: $538,000 - $613,000
2
Beds
1
Bath
1,288
Sq Ft
$449/Sq Ft
Est. Value
About This Home
This home is located at 33 Crescent Dr, Bridgewater, MA 02324 and is currently estimated at $577,977, approximately $448 per square foot. 33 Crescent Dr is a home located in Plymouth County with nearby schools including Mitchell Elementary School, Williams Intermediate School, and Bridgewater Middle School.
Ownership History
Date
Name
Owned For
Owner Type
Purchase Details
Closed on
Dec 15, 2000
Sold by
Baroni Rosemarie E Est
Bought by
Nixon William T
Current Estimated Value
Home Financials for this Owner
Home Financials are based on the most recent Mortgage that was taken out on this home.
Original Mortgage
$103,900
Outstanding Balance
$38,288
Interest Rate
7.7%
Mortgage Type
Purchase Money Mortgage
Estimated Equity
$539,689
Create a Home Valuation Report for This Property
The Home Valuation Report is an in-depth analysis detailing your home's value as well as a comparison with similar homes in the area
Home Values in the Area
Average Home Value in this Area
Purchase History
| Date | Buyer | Sale Price | Title Company |
|---|---|---|---|
| Nixon William T | $194,900 | -- |
Source: Public Records
Mortgage History
| Date | Status | Borrower | Loan Amount |
|---|---|---|---|
| Open | Nixon William T | $103,900 | |
| Previous Owner | Nixon William T | $75,000 |
Source: Public Records
Tax History
| Year | Tax Paid | Tax Assessment Tax Assessment Total Assessment is a certain percentage of the fair market value that is determined by local assessors to be the total taxable value of land and additions on the property. | Land | Improvement |
|---|---|---|---|---|
| 2025 | $6,098 | $515,500 | $223,100 | $292,400 |
| 2024 | $5,826 | $479,900 | $212,400 | $267,500 |
| 2023 | $5,804 | $452,000 | $198,500 | $253,500 |
| 2022 | $5,717 | $399,200 | $174,200 | $225,000 |
| 2021 | $10,522 | $348,000 | $155,500 | $192,500 |
| 2020 | $10,262 | $334,700 | $149,500 | $185,200 |
| 2019 | $7,030 | $328,400 | $149,500 | $178,900 |
| 2018 | $13,253 | $313,200 | $145,200 | $168,000 |
| 2017 | $4,608 | $295,200 | $145,200 | $150,000 |
| 2016 | $4,421 | $284,500 | $142,400 | $142,100 |
| 2015 | $4,425 | $272,500 | $138,200 | $134,300 |
| 2014 | $4,300 | $264,600 | $134,100 | $130,500 |
Source: Public Records
Map
Nearby Homes
- 51 Cottage St
- 220 Bedford St Unit E-6
- 220 Bedford St Unit 32
- 220 Bedford St Unit 86
- 120 Worcester St
- 1 Anacki Ln Unit 1
- 0 Bedford St Unit 73480500
- 8 North St
- 180 Main St Unit D80
- 180 Main St Unit 6109
- 180 Main St Unit 6305
- 180 Main St Unit B29
- 180 Main St Unit 4105
- 180 Main St Unit f148
- 180 Main St Unit B32
- 180 Main St Unit 6101
- 5 Liberty Rd Unit 5
- 47 Hale St
- Lot 2 Fontana Way
- 85 Cedar Crest Dr
- 45 Crescent Dr
- 21 Crescent Dr
- 28 Crescent Dr
- 38 Crescent Dr
- 57 Crescent Dr
- 9 Crescent Dr
- 50 Crescent Dr
- 16 Crescent Dr
- 187 Crescent St
- 179 Crescent St
- 62 Crescent Dr
- 69 Crescent Dr
- 307 South St Unit 1
- 309 South St
- 307 South St
- 307 South St Unit 307
- 309 South St
- 311 South St
- 321 South St
- 333 South St
Your Personal Tour Guide
Ask me questions while you tour the home.