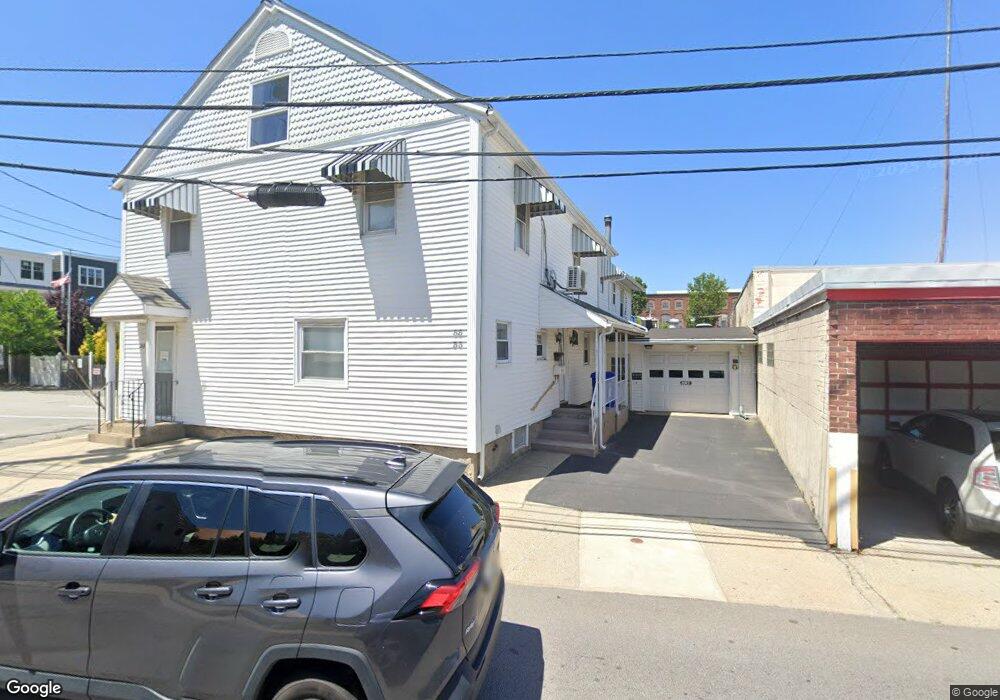
33 Cross St Central Falls, RI 02863
4
Beds
4
Baths
3,804
Sq Ft
14,810
Sq Ft Lot
About This Home
This home is located at 33 Cross St, Central Falls, RI 02863. 33 Cross St is a home located in Providence County with nearby schools including Central Falls Senior High School and Saint Raphael Academy.
Create a Home Valuation Report for This Property
The Home Valuation Report is an in-depth analysis detailing your home's value as well as a comparison with similar homes in the area
Home Values in the Area
Average Home Value in this Area
Tax History
| Year | Tax Paid | Tax Assessment Tax Assessment Total Assessment is a certain percentage of the fair market value that is determined by local assessors to be the total taxable value of land and additions on the property. | Land | Improvement |
|---|---|---|---|---|
| 2025 | $8,021 | $607,200 | $142,300 | $464,900 |
| 2024 | $8,305 | $441,500 | $122,300 | $319,200 |
| 2023 | $8,190 | $441,500 | $122,300 | $319,200 |
| 2022 | $5,316 | $443,000 | $122,300 | $320,700 |
| 2021 | $6,033 | $253,900 | $42,900 | $211,000 |
| 2020 | $6,015 | $253,900 | $42,900 | $211,000 |
| 2019 | $6,287 | $253,900 | $42,900 | $211,000 |
| 2018 | $5,370 | $204,100 | $32,600 | $171,500 |
| 2017 | $5,370 | $204,100 | $32,700 | $171,400 |
| 2016 | $5,292 | $204,100 | $32,700 | $171,400 |
| 2015 | $5,377 | $194,600 | $29,700 | $164,900 |
| 2014 | $5,305 | $194,600 | $29,700 | $164,900 |
| 2013 | $5,005 | $194,600 | $29,700 | $164,900 |
Source: Public Records
Map
Nearby Homes
- 511 High St
- 517 High St
- 404 Roosevelt Ave Unit 401
- 396 Roosevelt Ave
- 300 Front St Unit 105
- 300 Front St Unit 409
- 256 High St
- 7 Fales St
- 30 Foundry St Unit 6
- 234 Central St Unit 236
- 35 Laurel St
- 88 Barton St
- 78 Barton St
- 84 Barton St
- 153 Central Ave
- 79 W Cole St
- 48 Kossuth St
- 35 Rand St
- 76 Sylvian St Unit 80
- 133 Cottage St
Your Personal Tour Guide
Ask me questions while you tour the home.