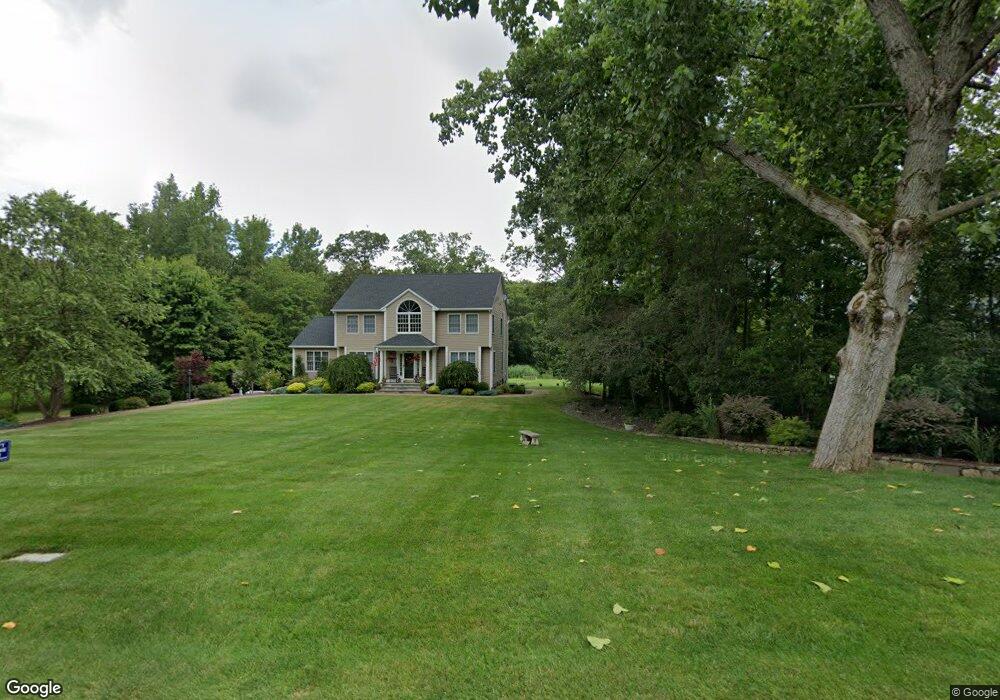
33 Cunningham Ln Pawling, NY 12564
Estimated Value: $749,000 - $949,000
4
Beds
3
Baths
3,495
Sq Ft
$236/Sq Ft
Est. Value
About This Home
This home is located at 33 Cunningham Ln, Pawling, NY 12564 and is currently estimated at $825,219, approximately $236 per square foot. 33 Cunningham Ln is a home located in Dutchess County with nearby schools including Pawling Elementary School, Pawling Middle School, and Pawling High School.
Ownership History
Date
Name
Owned For
Owner Type
Purchase Details
Closed on
Oct 4, 2007
Sold by
Budimir Marija
Bought by
Novakovic Dejan
Current Estimated Value
Home Financials for this Owner
Home Financials are based on the most recent Mortgage that was taken out on this home.
Original Mortgage
$540,000
Outstanding Balance
$227,209
Interest Rate
6.49%
Mortgage Type
Purchase Money Mortgage
Estimated Equity
$598,010
Purchase Details
Closed on
Oct 2, 2007
Sold by
Weichert Relocation Resou
Bought by
Budimir Marija
Home Financials for this Owner
Home Financials are based on the most recent Mortgage that was taken out on this home.
Original Mortgage
$540,000
Outstanding Balance
$227,209
Interest Rate
6.49%
Mortgage Type
Purchase Money Mortgage
Estimated Equity
$598,010
Purchase Details
Closed on
Aug 3, 2001
Sold by
Reilly Const Inc
Bought by
Hall James
Create a Home Valuation Report for This Property
The Home Valuation Report is an in-depth analysis detailing your home's value as well as a comparison with similar homes in the area
Home Values in the Area
Average Home Value in this Area
Purchase History
| Date | Buyer | Sale Price | Title Company |
|---|---|---|---|
| Novakovic Dejan | -- | -- | |
| Budimir Marija | $600,000 | -- | |
| Weichert Relocation Resou | $725,000 | -- | |
| Hall James | $130,000 | Keith Labis | |
| Reilly Const Inc | $130,000 | Jay Hogan |
Source: Public Records
Mortgage History
| Date | Status | Borrower | Loan Amount |
|---|---|---|---|
| Open | Weichert Relocation Resou | $540,000 |
Source: Public Records
Tax History Compared to Growth
Tax History
| Year | Tax Paid | Tax Assessment Tax Assessment Total Assessment is a certain percentage of the fair market value that is determined by local assessors to be the total taxable value of land and additions on the property. | Land | Improvement |
|---|---|---|---|---|
| 2024 | $15,292 | $216,645 | $31,700 | $184,945 |
| 2023 | $15,419 | $216,645 | $31,700 | $184,945 |
| 2019 | $13,818 | $216,645 | $31,700 | $184,945 |
Source: Public Records
Map
Nearby Homes
- 5 Perri Ln
- 14 Old Route 55
- 85 Harmony Hill Rd
- 2 Bridle Way
- 23 Union St
- 40 Walnut St
- 0 Walnut St
- 1D Margherita Ln
- 1C Margherita Ln
- 178 Charles Colman Blvd
- 16 Townsend Blvd
- 215 Little Pond Rd
- 3 Pine Dr
- 13 Cushing Green S
- 126 Old Route 55
- 2 Spruce St
- 10 Rebecca Dr
- 51 Estate Dr
- 322 Old Route 22
- 21 Kings Way
- 45 Cunningham Ln
- 49 Cunningham Ln
- 59 Cunningham Ln
- 105 Anderson Dr
- 48 Cunningham Ln
- 71 Cunningham Ln
- 54 Cunningham Ln
- 28 Cunningham Ln
- 58 Cunningham Ln
- 64 Cunningham Ln
- 68 Cunningham Ln
- 20 Cunningham Ln
- 19 Cunningham Ln
- 103 Anderson Dr
- 70 Cunningham Ln
- 106 Anderson Dr
- 106 Anderson Dr
- 42 Millstream Ct
- 12 Cunningham Ln
- 43 Harmony Hill Rd