Estimated Value: $588,768 - $630,000
3
Beds
3
Baths
1,860
Sq Ft
$330/Sq Ft
Est. Value
About This Home
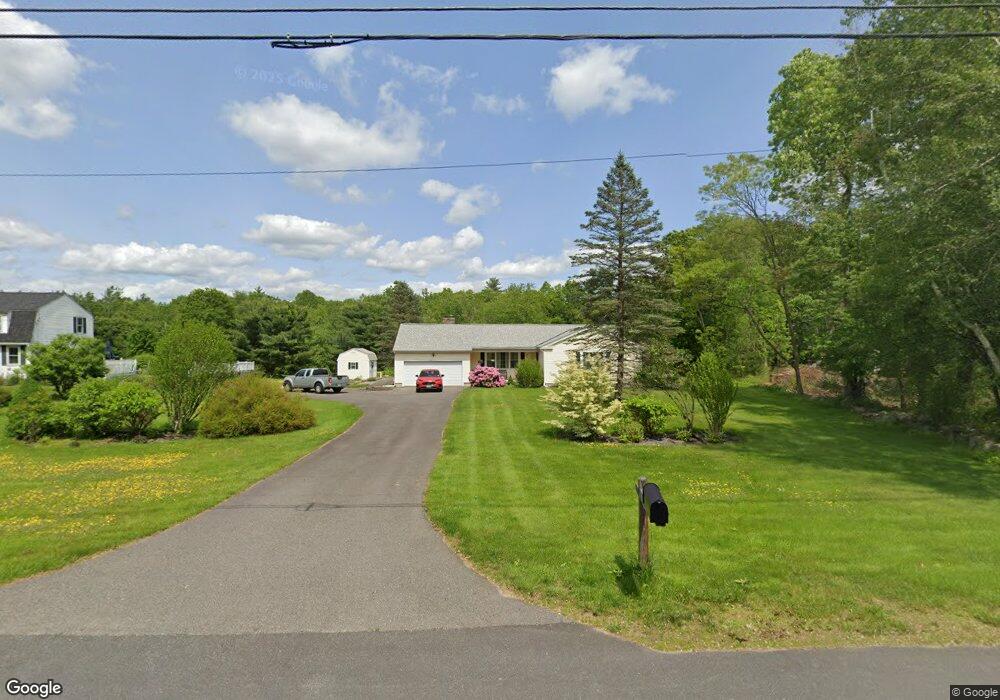
This home is located at 33 Damren Rd, Derry, NH 03038 and is currently estimated at $613,442, approximately $329 per square foot. 33 Damren Rd is a home located in Rockingham County with nearby schools including East Derry Memorial Elementary School, Gilbert H. Hood Middle School, and Pinkerton Academy.
Ownership History
Date
Name
Owned For
Owner Type
Purchase Details
Closed on
Feb 27, 2015
Sold by
Goldstein Ira R and Spacone Lisa R
Bought by
Goldstein Lisa R
Current Estimated Value
Purchase Details
Closed on
Sep 23, 2008
Sold by
Woscyna Gary P
Bought by
Walsh William B and Peaslee Shirely A
Home Financials for this Owner
Home Financials are based on the most recent Mortgage that was taken out on this home.
Original Mortgage
$225,600
Interest Rate
6.54%
Mortgage Type
Purchase Money Mortgage
Purchase Details
Closed on
Aug 30, 1996
Sold by
Gunter Marie and Gunter Stewart W
Bought by
Kevlik Heather A
Create a Home Valuation Report for This Property
The Home Valuation Report is an in-depth analysis detailing your home's value as well as a comparison with similar homes in the area
Home Values in the Area
Average Home Value in this Area
Purchase History
| Date | Buyer | Sale Price | Title Company |
|---|---|---|---|
| Goldstein Lisa R | -- | -- | |
| Walsh William B | $282,000 | -- | |
| Kevlik Heather A | $122,000 | -- |
Source: Public Records
Mortgage History
| Date | Status | Borrower | Loan Amount |
|---|---|---|---|
| Previous Owner | Kevlik Heather A | $212,000 | |
| Previous Owner | Kevlik Heather A | $225,600 | |
| Previous Owner | Kevlik Heather A | $283,200 | |
| Previous Owner | Kevlik Heather A | $35,400 |
Source: Public Records
Tax History
| Year | Tax Paid | Tax Assessment Tax Assessment Total Assessment is a certain percentage of the fair market value that is determined by local assessors to be the total taxable value of land and additions on the property. | Land | Improvement |
|---|---|---|---|---|
| 2025 | $10,139 | $533,900 | $207,000 | $326,900 |
| 2024 | $9,979 | $533,900 | $207,000 | $326,900 |
| 2023 | $9,478 | $458,300 | $175,900 | $282,400 |
| 2022 | $8,726 | $458,300 | $175,900 | $282,400 |
| 2021 | $8,745 | $353,200 | $135,800 | $217,400 |
| 2020 | $8,597 | $353,200 | $135,800 | $217,400 |
| 2019 | $8,439 | $323,100 | $106,200 | $216,900 |
| 2018 | $8,410 | $323,100 | $106,200 | $216,900 |
| 2017 | $7,811 | $283,700 | $99,200 | $184,500 |
| 2016 | $7,677 | $283,700 | $99,200 | $184,500 |
| 2015 | $7,661 | $262,100 | $99,200 | $162,900 |
| 2014 | $7,711 | $262,100 | $99,200 | $162,900 |
| 2013 | $7,510 | $238,500 | $89,200 | $149,300 |
Source: Public Records
Map
Nearby Homes
- 211 Hampstead Rd
- 3 Pine Bluff
- 12 Halls Village Rd
- 47 Drew Woods Dr
- 7 Cameron Ct Unit 7
- 1 Cameron Ct Unit 1
- 0 Jack Rd
- 50 Page Ln
- 12 Glastombury Dr
- 15 Bonnie Ln Unit R
- 37 Colby Farm Rd
- 35 Colby Farm Rd
- 128 N Shore Rd
- 8 Ians Path
- 7 Lincoln Ln
- 11 Robin Way Unit 2
- 11 Sunset Ave
- 118-1 Mills Shore Dr
- 118 Mills Shore Dr
- 5 Stone Fence Dr
Your Personal Tour Guide
Ask me questions while you tour the home.