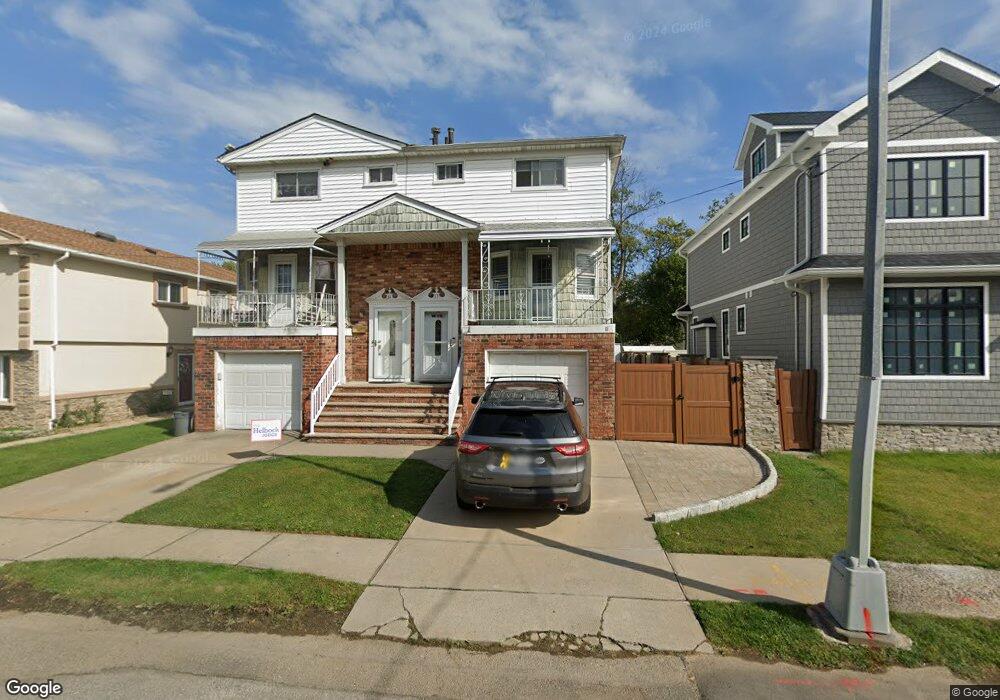
33 Dickie Ave Staten Island, NY 10314
Westerleigh NeighborhoodEstimated Value: $631,043 - $824,000
--
Bed
4
Baths
1,456
Sq Ft
$517/Sq Ft
Est. Value
About This Home
This home is located at 33 Dickie Ave, Staten Island, NY 10314 and is currently estimated at $752,511, approximately $516 per square foot. 33 Dickie Ave is a home located in Richmond County with nearby schools including P.S. 30 Westerleigh, I.S. 51 Edwin Markham, and Port Richmond High School.
Ownership History
Date
Name
Owned For
Owner Type
Purchase Details
Closed on
May 29, 2009
Sold by
Wedlock Patricia
Bought by
Mchugh Patricia and Mchugh Seamus
Current Estimated Value
Home Financials for this Owner
Home Financials are based on the most recent Mortgage that was taken out on this home.
Original Mortgage
$124,952
Outstanding Balance
$81,715
Interest Rate
5.43%
Mortgage Type
New Conventional
Estimated Equity
$670,796
Purchase Details
Closed on
Nov 1, 2000
Sold by
Wedlock Stephen J and Wedlock Patricia
Bought by
Wedlock Patricia
Purchase Details
Closed on
Jul 7, 1995
Sold by
Tromer George A and Tromer Jane
Bought by
Nizza Joseph L and Nizza Rose Anne
Home Financials for this Owner
Home Financials are based on the most recent Mortgage that was taken out on this home.
Original Mortgage
$157,500
Interest Rate
7.49%
Purchase Details
Closed on
Jul 6, 1995
Sold by
Nizza Joseph L and Nizza Roseanne
Bought by
Wedlock Stephen J and Wedlock Patricia
Home Financials for this Owner
Home Financials are based on the most recent Mortgage that was taken out on this home.
Original Mortgage
$157,500
Interest Rate
7.49%
Create a Home Valuation Report for This Property
The Home Valuation Report is an in-depth analysis detailing your home's value as well as a comparison with similar homes in the area
Home Values in the Area
Average Home Value in this Area
Purchase History
| Date | Buyer | Sale Price | Title Company |
|---|---|---|---|
| Mchugh Patricia | -- | None Available | |
| Wedlock Patricia | $15,000 | First American Title Ins Co | |
| Nizza Joseph L | -- | Chicago Title Insurance Co | |
| Wedlock Stephen J | $175,000 | -- |
Source: Public Records
Mortgage History
| Date | Status | Borrower | Loan Amount |
|---|---|---|---|
| Open | Mchugh Patricia | $124,952 | |
| Closed | Wedlock Stephen J | $157,500 |
Source: Public Records
Tax History Compared to Growth
Tax History
| Year | Tax Paid | Tax Assessment Tax Assessment Total Assessment is a certain percentage of the fair market value that is determined by local assessors to be the total taxable value of land and additions on the property. | Land | Improvement |
|---|---|---|---|---|
| 2025 | $6,820 | $40,680 | $10,814 | $29,866 |
| 2024 | $6,820 | $40,920 | $10,157 | $30,763 |
| 2023 | $6,513 | $32,069 | $9,049 | $23,020 |
| 2022 | $6,040 | $37,620 | $12,240 | $25,380 |
| 2021 | $6,065 | $36,660 | $12,240 | $24,420 |
| 2020 | $6,044 | $34,080 | $12,240 | $21,840 |
| 2019 | $5,626 | $35,640 | $12,240 | $23,400 |
| 2018 | $5,150 | $26,724 | $9,841 | $16,883 |
| 2017 | $4,840 | $25,214 | $11,405 | $13,809 |
| 2016 | $4,731 | $25,214 | $11,380 | $13,834 |
| 2015 | $4,220 | $24,960 | $13,620 | $11,340 |
| 2014 | $4,220 | $23,580 | $13,620 | $9,960 |
Source: Public Records
Map
Nearby Homes