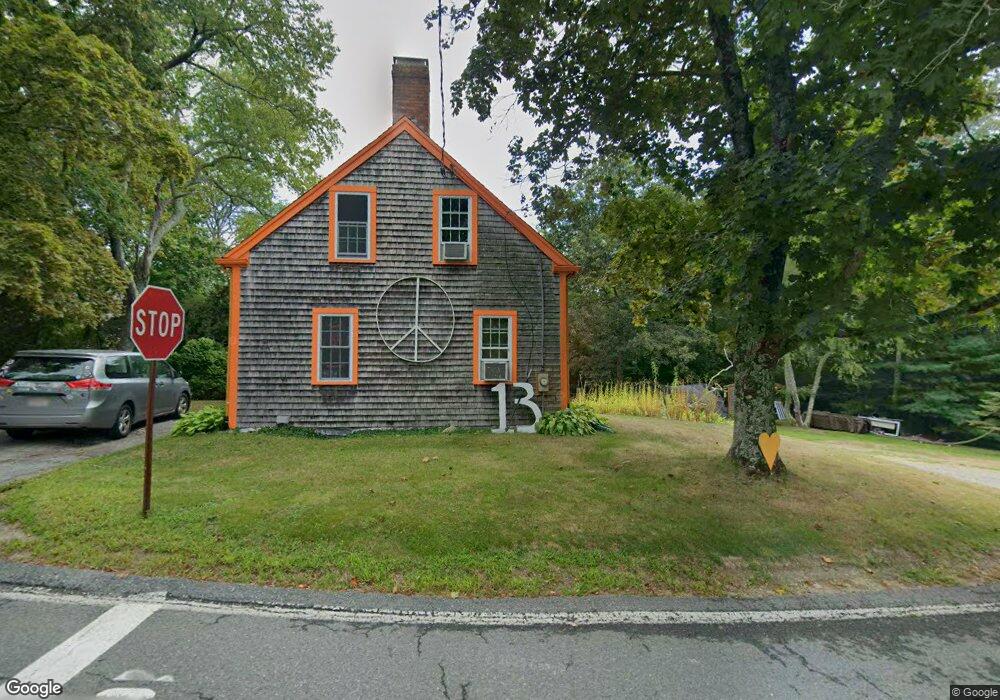
33 Gate St Carver, MA 02330
Estimated Value: $506,000 - $646,000
3
Beds
1
Bath
1,122
Sq Ft
$494/Sq Ft
Est. Value
About This Home
This home is located at 33 Gate St, Carver, MA 02330 and is currently estimated at $554,341, approximately $494 per square foot. 33 Gate St is a home located in Plymouth County with nearby schools including Carver Elementary School and Carver Middle/High School.
Ownership History
Date
Name
Owned For
Owner Type
Purchase Details
Closed on
May 30, 2014
Sold by
Mulready Matthew and Cannon Melissa J
Bought by
Eames Brian A
Current Estimated Value
Purchase Details
Closed on
Jul 3, 2006
Sold by
Eames Brian A
Bought by
Mulready Matthew and Cannon Melissa J
Home Financials for this Owner
Home Financials are based on the most recent Mortgage that was taken out on this home.
Original Mortgage
$246,400
Interest Rate
6.58%
Mortgage Type
Purchase Money Mortgage
Purchase Details
Closed on
Jun 12, 1996
Sold by
Joyce Theresa M
Bought by
Silva Charles R and Silva Gail
Create a Home Valuation Report for This Property
The Home Valuation Report is an in-depth analysis detailing your home's value as well as a comparison with similar homes in the area
Home Values in the Area
Average Home Value in this Area
Purchase History
| Date | Buyer | Sale Price | Title Company |
|---|---|---|---|
| Eames Brian A | -- | -- | |
| Mulready Matthew | $308,000 | -- | |
| Silva Charles R | $40,000 | -- |
Source: Public Records
Mortgage History
| Date | Status | Borrower | Loan Amount |
|---|---|---|---|
| Previous Owner | Silva Charles R | $242,700 | |
| Previous Owner | Silva Charles R | $246,400 | |
| Previous Owner | Silva Charles R | $61,600 |
Source: Public Records
Tax History
| Year | Tax Paid | Tax Assessment Tax Assessment Total Assessment is a certain percentage of the fair market value that is determined by local assessors to be the total taxable value of land and additions on the property. | Land | Improvement |
|---|---|---|---|---|
| 2025 | $5,577 | $402,100 | $155,000 | $247,100 |
| 2024 | $5,300 | $374,000 | $152,000 | $222,000 |
| 2023 | $5,153 | $353,200 | $152,000 | $201,200 |
| 2022 | $4,853 | $303,700 | $129,900 | $173,800 |
| 2021 | $4,618 | $272,600 | $116,000 | $156,600 |
| 2020 | $4,394 | $255,600 | $108,400 | $147,200 |
| 2019 | $4,235 | $248,400 | $105,200 | $143,200 |
| 2018 | $4,067 | $227,300 | $105,200 | $122,100 |
| 2017 | $3,842 | $217,200 | $101,300 | $115,900 |
| 2016 | $3,532 | $207,400 | $96,400 | $111,000 |
| 2015 | $3,448 | $202,700 | $96,400 | $106,300 |
| 2014 | $3,572 | $210,000 | $121,900 | $88,100 |
Source: Public Records
Map
Nearby Homes
Your Personal Tour Guide
Ask me questions while you tour the home.