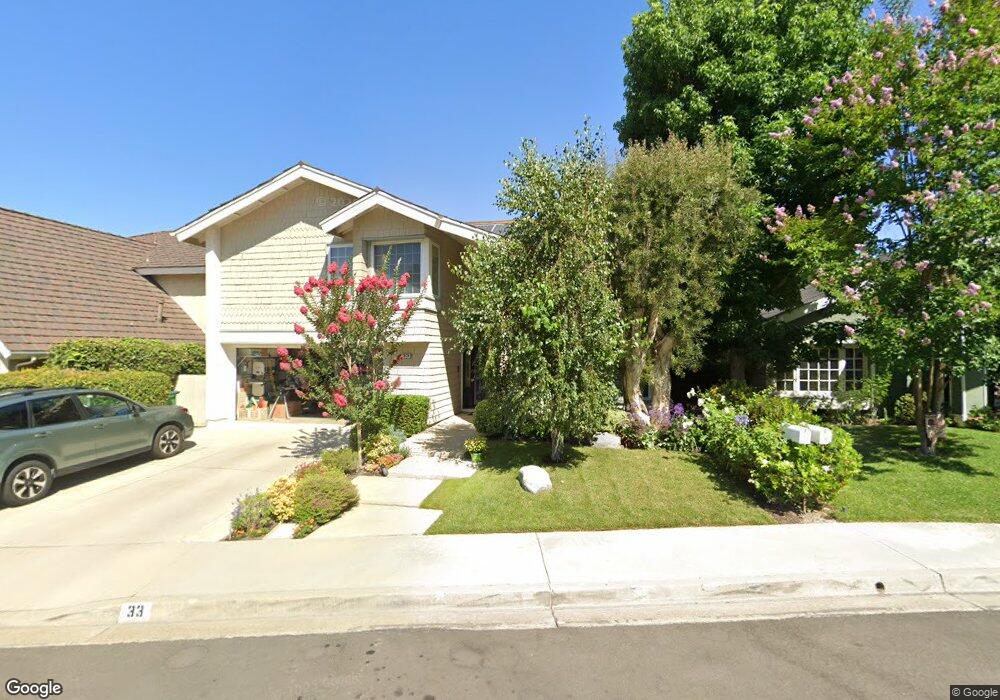
33 Glenn Irvine, CA 92620
Northwood NeighborhoodEstimated Value: $1,841,950 - $2,055,000
4
Beds
3
Baths
2,828
Sq Ft
$695/Sq Ft
Est. Value
About This Home
This home is located at 33 Glenn, Irvine, CA 92620 and is currently estimated at $1,964,238, approximately $694 per square foot. 33 Glenn is a home located in Orange County with nearby schools including Northwood Elementary School, Sierra Vista Middle School, and Northwood High School.
Ownership History
Date
Name
Owned For
Owner Type
Purchase Details
Closed on
Apr 15, 2014
Sold by
Ogden John C and Ogden Nancy V
Bought by
The Ogden Family 2001 Revocable Trust
Current Estimated Value
Purchase Details
Closed on
Feb 22, 2010
Sold by
Ogden John C and Ogden Nancy Y
Bought by
Ogden John C and Ogden Nancy Y
Home Financials for this Owner
Home Financials are based on the most recent Mortgage that was taken out on this home.
Original Mortgage
$190,000
Interest Rate
5.03%
Mortgage Type
New Conventional
Purchase Details
Closed on
May 16, 2001
Sold by
Ogden John C and Ogden Nancy Y
Bought by
Ogden John C and Ogden Nancy Y
Purchase Details
Closed on
Apr 2, 1996
Sold by
Stenquist Russell R and Stenquist Joni K
Bought by
Ogden John C and Ogden Nancy Y
Home Financials for this Owner
Home Financials are based on the most recent Mortgage that was taken out on this home.
Original Mortgage
$172,500
Interest Rate
7.34%
Mortgage Type
Balloon
Create a Home Valuation Report for This Property
The Home Valuation Report is an in-depth analysis detailing your home's value as well as a comparison with similar homes in the area
Home Values in the Area
Average Home Value in this Area
Purchase History
| Date | Buyer | Sale Price | Title Company |
|---|---|---|---|
| The Ogden Family 2001 Revocable Trust | -- | None Available | |
| Ogden John C | -- | Lsi Local Solutions | |
| Ogden John C | -- | Orange Coast Title Company | |
| Ogden John C | $322,500 | American Title Ins Co |
Source: Public Records
Mortgage History
| Date | Status | Borrower | Loan Amount |
|---|---|---|---|
| Closed | Ogden John C | $190,000 | |
| Closed | Ogden John C | $172,500 |
Source: Public Records
Tax History
| Year | Tax Paid | Tax Assessment Tax Assessment Total Assessment is a certain percentage of the fair market value that is determined by local assessors to be the total taxable value of land and additions on the property. | Land | Improvement |
|---|---|---|---|---|
| 2025 | $5,584 | $535,753 | $232,983 | $302,770 |
| 2024 | $5,584 | $525,249 | $228,415 | $296,834 |
| 2023 | $5,438 | $514,950 | $223,936 | $291,014 |
| 2022 | $5,331 | $504,853 | $219,545 | $285,308 |
| 2021 | $5,207 | $494,954 | $215,240 | $279,714 |
| 2020 | $5,177 | $489,879 | $213,033 | $276,846 |
| 2019 | $5,061 | $480,274 | $208,856 | $271,418 |
| 2018 | $4,970 | $470,857 | $204,760 | $266,097 |
| 2017 | $4,866 | $461,625 | $200,745 | $260,880 |
| 2016 | $4,651 | $452,574 | $196,809 | $255,765 |
| 2015 | $4,581 | $445,776 | $193,852 | $251,924 |
| 2014 | $4,492 | $437,044 | $190,054 | $246,990 |
Source: Public Records
Map
Nearby Homes
- 22 Hunter
- 2 Mccormick
- 54 Shadowplay
- 8 Monticello
- 7 Nantucket
- 39 Cape Cod
- 7 Boone
- 34 Great Lawn
- 9 Sheridan
- 50 Vintage
- 42 Vintage Unit 102
- 5200 Irvine Blvd Unit 497
- 5200 Irvine Blvd
- 5200 Irvine Blvd Unit 123
- 5200 Irvine Blvd Unit 256
- 5200 Irvine Blvd Unit 254
- 5200 Irvine Blvd Unit 360
- 5200 Irvine Blvd Unit 156
- 5200 Irvine Blvd Unit 183
- 5200 Irvine Blvd Unit 54
Your Personal Tour Guide
Ask me questions while you tour the home.