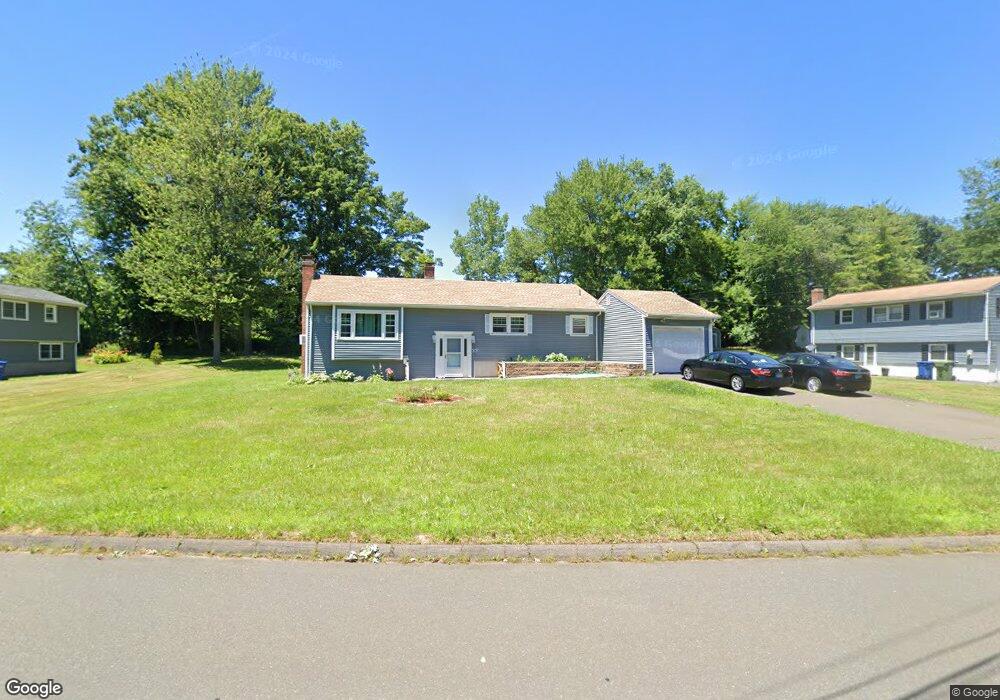
33 Gloria St Windsor, CT 06095
Estimated Value: $346,000 - $388,693
4
Beds
3
Baths
1,268
Sq Ft
$284/Sq Ft
Est. Value
About This Home
This home is located at 33 Gloria St, Windsor, CT 06095 and is currently estimated at $360,673, approximately $284 per square foot. 33 Gloria St is a home located in Hartford County with nearby schools including Poquonock Elementary School, Clover Street School, and Sage Park Middle School.
Ownership History
Date
Name
Owned For
Owner Type
Purchase Details
Closed on
Jan 29, 2007
Sold by
Buster Edward
Bought by
Whyte Angela
Current Estimated Value
Home Financials for this Owner
Home Financials are based on the most recent Mortgage that was taken out on this home.
Original Mortgage
$240,000
Outstanding Balance
$142,944
Interest Rate
6.15%
Mortgage Type
Purchase Money Mortgage
Estimated Equity
$217,729
Create a Home Valuation Report for This Property
The Home Valuation Report is an in-depth analysis detailing your home's value as well as a comparison with similar homes in the area
Home Values in the Area
Average Home Value in this Area
Purchase History
| Date | Buyer | Sale Price | Title Company |
|---|---|---|---|
| Whyte Angela | $240,000 | -- |
Source: Public Records
Mortgage History
| Date | Status | Borrower | Loan Amount |
|---|---|---|---|
| Open | Whyte Angela | $240,000 | |
| Previous Owner | Whyte Angela | $120,000 | |
| Previous Owner | Whyte Angela | $68,000 | |
| Previous Owner | Whyte Angela | $38,000 |
Source: Public Records
Tax History
| Year | Tax Paid | Tax Assessment Tax Assessment Total Assessment is a certain percentage of the fair market value that is determined by local assessors to be the total taxable value of land and additions on the property. | Land | Improvement |
|---|---|---|---|---|
| 2025 | $5,959 | $209,440 | $56,980 | $152,460 |
| 2024 | $6,350 | $209,440 | $56,980 | $152,460 |
| 2023 | $4,401 | $130,970 | $40,110 | $90,860 |
| 2022 | $4,357 | $130,970 | $40,110 | $90,860 |
| 2021 | $4,357 | $130,970 | $40,110 | $90,860 |
| 2020 | $4,336 | $130,970 | $40,110 | $90,860 |
| 2019 | $4,241 | $130,970 | $40,110 | $90,860 |
| 2018 | $4,224 | $128,170 | $40,110 | $88,060 |
| 2017 | $4,159 | $128,170 | $40,110 | $88,060 |
| 2016 | $4,040 | $128,170 | $40,110 | $88,060 |
| 2015 | $3,963 | $128,170 | $40,110 | $88,060 |
| 2014 | $3,905 | $128,170 | $40,110 | $88,060 |
Source: Public Records
Map
Nearby Homes
Your Personal Tour Guide
Ask me questions while you tour the home.