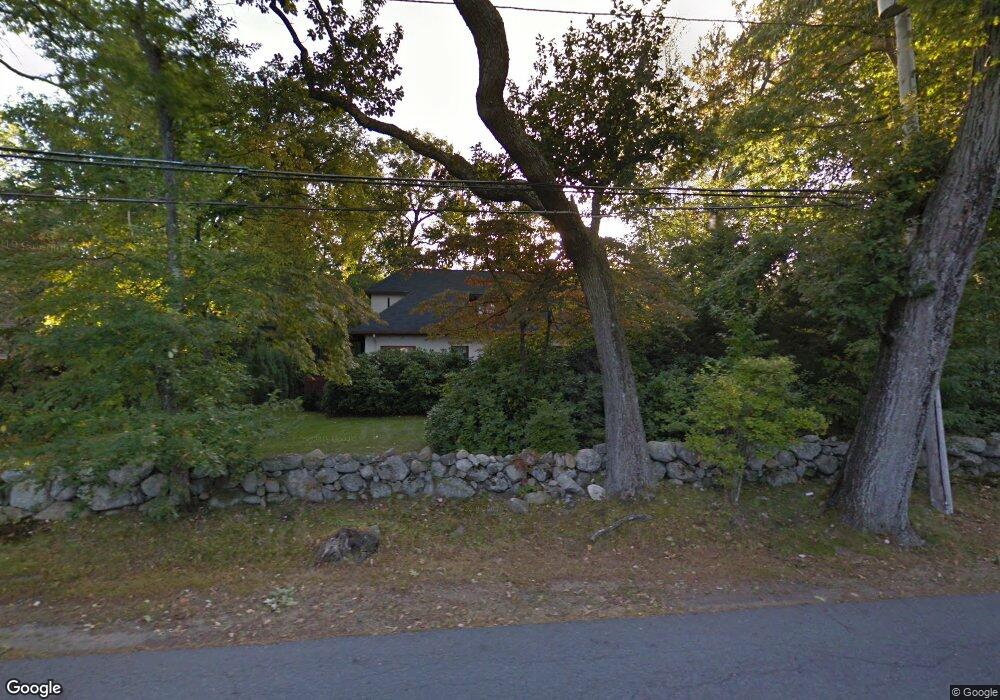
33 Hidden Rd Andover, MA 01810
Southern Andover NeighborhoodEstimated Value: $1,069,000 - $1,615,000
4
Beds
4
Baths
3,662
Sq Ft
$373/Sq Ft
Est. Value
About This Home
This home is located at 33 Hidden Rd, Andover, MA 01810 and is currently estimated at $1,366,901, approximately $373 per square foot. 33 Hidden Rd is a home located in Essex County with nearby schools including South Elementary School, Doherty Middle School, and Andover High School.
Ownership History
Date
Name
Owned For
Owner Type
Purchase Details
Closed on
Jun 25, 2021
Sold by
Adams Samuel and Adams Courtney S
Bought by
Thomas Jessica
Current Estimated Value
Home Financials for this Owner
Home Financials are based on the most recent Mortgage that was taken out on this home.
Original Mortgage
$724,500
Outstanding Balance
$654,514
Interest Rate
2.9%
Mortgage Type
Purchase Money Mortgage
Estimated Equity
$712,387
Purchase Details
Closed on
Jul 29, 2005
Sold by
Hamilton John F and Hamilton Virginia E
Bought by
Adams Samuel and Adams Courtney
Home Financials for this Owner
Home Financials are based on the most recent Mortgage that was taken out on this home.
Original Mortgage
$157,500
Interest Rate
5.67%
Mortgage Type
Purchase Money Mortgage
Purchase Details
Closed on
Jun 30, 1989
Sold by
Stier Robert
Bought by
Hamilton John
Create a Home Valuation Report for This Property
The Home Valuation Report is an in-depth analysis detailing your home's value as well as a comparison with similar homes in the area
Home Values in the Area
Average Home Value in this Area
Purchase History
| Date | Buyer | Sale Price | Title Company |
|---|---|---|---|
| Thomas Jessica | $1,000,000 | None Available | |
| Adams Samuel | $707,500 | -- | |
| Adams Samuel | $707,500 | -- | |
| Hamilton John | $335,000 | -- | |
| Hamilton John | $335,000 | -- |
Source: Public Records
Mortgage History
| Date | Status | Borrower | Loan Amount |
|---|---|---|---|
| Open | Thomas Jessica | $724,500 | |
| Previous Owner | Hamilton John | $406,000 | |
| Previous Owner | Adams Samuel | $157,500 | |
| Previous Owner | Hamilton John | $214,500 |
Source: Public Records
Tax History
| Year | Tax Paid | Tax Assessment Tax Assessment Total Assessment is a certain percentage of the fair market value that is determined by local assessors to be the total taxable value of land and additions on the property. | Land | Improvement |
|---|---|---|---|---|
| 2024 | $14,496 | $1,125,500 | $611,400 | $514,100 |
| 2023 | $13,839 | $1,013,100 | $550,700 | $462,400 |
| 2022 | $13,140 | $900,000 | $478,900 | $421,100 |
| 2021 | $12,561 | $821,500 | $435,200 | $386,300 |
| 2020 | $12,043 | $802,300 | $424,500 | $377,800 |
| 2019 | $11,692 | $765,700 | $412,200 | $353,500 |
| 2018 | $11,280 | $721,200 | $396,400 | $324,800 |
| 2017 | $10,784 | $710,400 | $388,400 | $322,000 |
| 2016 | $10,528 | $710,400 | $388,400 | $322,000 |
| 2015 | $10,130 | $676,700 | $373,300 | $303,400 |
Source: Public Records
Map
Nearby Homes
- 16 Porter Rd
- 4 Hammond Way
- 31 Porter Rd
- 57 Salem St
- 49 Salem St
- 52 Salem St
- 56 Sunset Rock Rd
- 3 West Hollow
- 344 S Main St
- 133B Salem
- 154 Main St
- 3 Torr St
- 23 Belknap Dr
- 105 Central St
- 100.5 Main St Unit Q
- 96 N Main St Unit 3
- 11 Wyncrest Cir
- 3 Regency Ridge
- 33 Chestnut St Unit 2
- 81 Chestnut St Unit 81
Your Personal Tour Guide
Ask me questions while you tour the home.