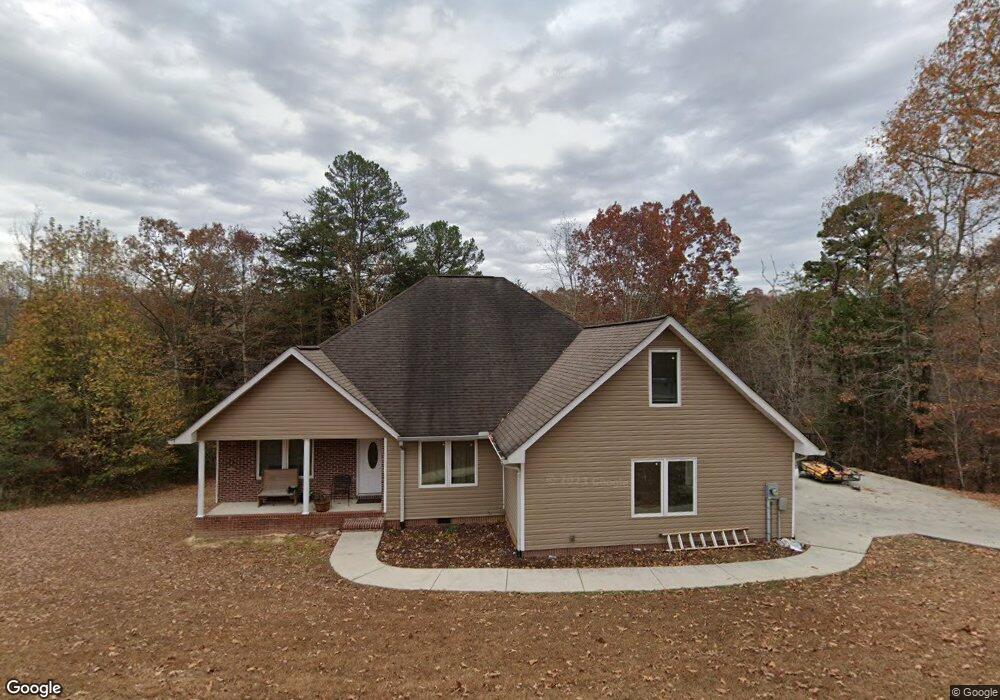
33 Hidden Ridge Loop Dunlap, TN 37327
Estimated Value: $375,541 - $478,000
Studio
--
Bath
2,048
Sq Ft
$207/Sq Ft
Est. Value
About This Home
This home is located at 33 Hidden Ridge Loop, Dunlap, TN 37327 and is currently estimated at $424,885, approximately $207 per square foot. 33 Hidden Ridge Loop is a home with nearby schools including Griffith Elementary School, Sequatchie County Middle School, and Sequatchie County High School.
Ownership History
Date
Name
Owned For
Owner Type
Purchase Details
Closed on
Sep 3, 2015
Sold by
Castaneda Roberto and Torres Dania Santos
Bought by
Castaneda Roberto
Current Estimated Value
Purchase Details
Closed on
Sep 27, 2013
Sold by
Perry Steve
Bought by
Castaneda Roberto and Torres Dania Santos
Purchase Details
Closed on
Mar 7, 2011
Sold by
Perry Steve
Bought by
Perry Steve
Home Financials for this Owner
Home Financials are based on the most recent Mortgage that was taken out on this home.
Original Mortgage
$195,000
Interest Rate
4.77%
Purchase Details
Closed on
Feb 3, 2011
Sold by
Potts K Leon
Bought by
First National Bank Of Pikevil
Home Financials for this Owner
Home Financials are based on the most recent Mortgage that was taken out on this home.
Original Mortgage
$195,000
Interest Rate
4.77%
Purchase Details
Closed on
Dec 6, 2006
Bought by
Wife Potts K and Wife Karen D
Create a Home Valuation Report for This Property
The Home Valuation Report is an in-depth analysis detailing your home's value as well as a comparison with similar homes in the area
Home Values in the Area
Average Home Value in this Area
Purchase History
| Date | Buyer | Sale Price | Title Company |
|---|---|---|---|
| Castaneda Roberto | -- | -- | |
| Castaneda Roberto | -- | -- | |
| Castaneda Roberto | $195,000 | -- | |
| Perry Steve | $135,000 | -- | |
| First National Bank Of Pikevil | $165,000 | -- | |
| Wife Potts K | $12,500 | -- |
Source: Public Records
Mortgage History
| Date | Status | Borrower | Loan Amount |
|---|---|---|---|
| Previous Owner | Perry Steve | $195,000 |
Source: Public Records
Tax History
| Year | Tax Paid | Tax Assessment Tax Assessment Total Assessment is a certain percentage of the fair market value that is determined by local assessors to be the total taxable value of land and additions on the property. | Land | Improvement |
|---|---|---|---|---|
| 2025 | $1,707 | $92,950 | $4,950 | $88,000 |
| 2024 | $1,707 | $92,950 | $4,950 | $88,000 |
| 2023 | $1,707 | $92,950 | $4,950 | $88,000 |
| 2022 | $1,356 | $55,525 | $3,850 | $51,675 |
| 2021 | $1,356 | $55,525 | $3,850 | $51,675 |
| 2020 | $1,405 | $57,525 | $3,850 | $53,675 |
| 2019 | $1,405 | $57,525 | $3,850 | $53,675 |
| 2018 | $1,405 | $57,525 | $3,850 | $53,675 |
| 2017 | $1,405 | $57,525 | $3,850 | $53,675 |
| 2016 | $1,434 | $55,825 | $3,850 | $51,975 |
| 2015 | $1,434 | $55,825 | $3,850 | $51,975 |
| 2014 | $1,434 | $55,825 | $3,850 | $51,975 |
Source: Public Records
Map
Nearby Homes
- 118 Hidden Ridge Loop
- 347 Highland Dr
- 438 Highland Dr
- 000 Hudlow Loop Rd
- 58 Marilyn Ct
- 75A Hardin Rd
- 0 Hardin Rd Unit 1523572
- 0 Hardin Rd Unit 1321169
- 67 Shady Oaks Cove
- 0 Shady Oaks Cove Unit 1525918
- 5 Treeline Dr
- 4 Treeline Dr
- 0 Hudlow Loop Rd Unit 1523968
- 0 Hudlow Loop Rd Unit 1511092
- 0 Hudlow Loop Rd Unit RTC3045642
- 0 Treeline Dr Unit 1510685
- 0 Treeline Dr Unit RTC2815537
- 0 Treeline Dr Unit 1510684
- 0 Treeline Dr Unit RTC2815536
- 919 John Burch Rd
- 27 Hidden Ridge Loop
- 27 Hidden Ridge Loop Unit Lot 27
- 7 Hidden Ridge Loop
- 18 Hidden Ridge Loop
- 25 Hidden Ridge Loop
- 2 Highland Dr
- 0 Highland Dr
- 0 Highland Dr Unit 6129
- 0 Highland Dr Unit 1038945
- 0 Highland Dr Unit 1027437
- 0 Highland Dr Unit 1032652
- 0 Highland Dr Unit 1002634
- 0 Highland Dr Unit 8985
- 0 Highland Dr Unit 2917
- 0 Highland Dr Unit 1023696
- 0 Highland Dr Unit 6022
- 0 Highland Dr Unit 18930
- 0 Highland Dr Unit 8620
- 0 Highland Dr Unit 1123810
- 0 Highland Dr Unit 1143831
Your Personal Tour Guide
Ask me questions while you tour the home.