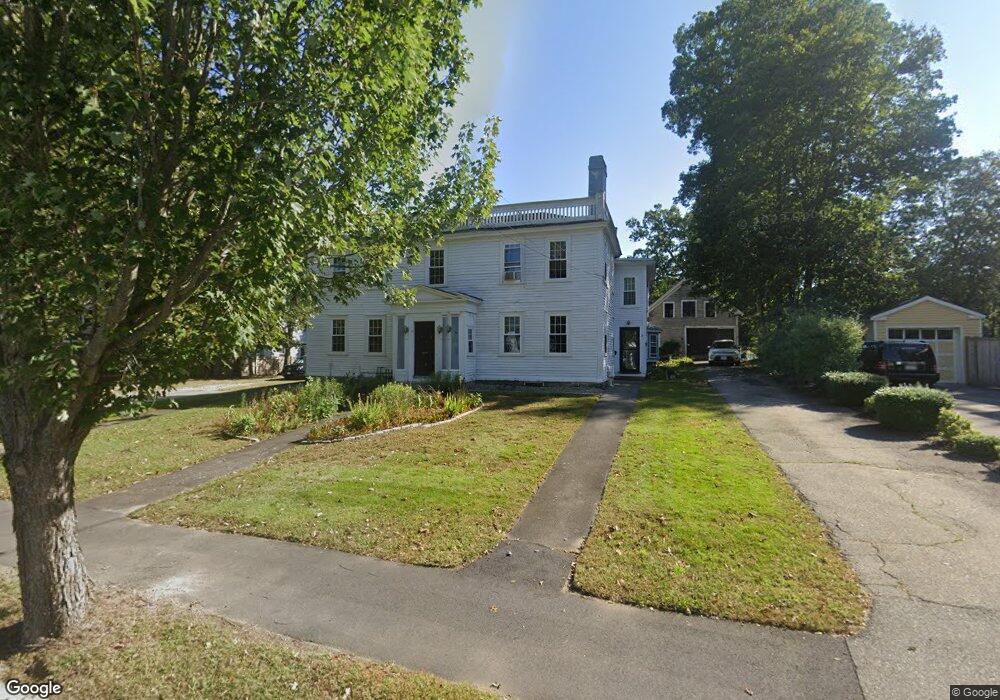
33 High St Andover, MA 01810
Shawsheen Heights NeighborhoodEstimated Value: $1,310,000 - $1,655,000
6
Beds
3
Baths
5,537
Sq Ft
$262/Sq Ft
Est. Value
About This Home
This home is located at 33 High St, Andover, MA 01810 and is currently estimated at $1,453,306, approximately $262 per square foot. 33 High St is a home located in Essex County with nearby schools including West Elementary School, Doherty Middle School, and Andover High School.
Ownership History
Date
Name
Owned For
Owner Type
Purchase Details
Closed on
Jul 22, 2021
Sold by
Cardin Ft and Cardin
Bought by
Cardin David
Current Estimated Value
Purchase Details
Closed on
Dec 6, 2019
Sold by
Cardin David
Bought by
Cardin Ft and Cardin
Purchase Details
Closed on
Jul 2, 2013
Sold by
Rayner Reid
Bought by
Rayner Cynthia
Home Financials for this Owner
Home Financials are based on the most recent Mortgage that was taken out on this home.
Original Mortgage
$470,000
Interest Rate
3.51%
Mortgage Type
New Conventional
Create a Home Valuation Report for This Property
The Home Valuation Report is an in-depth analysis detailing your home's value as well as a comparison with similar homes in the area
Home Values in the Area
Average Home Value in this Area
Purchase History
| Date | Buyer | Sale Price | Title Company |
|---|---|---|---|
| Cardin David | -- | None Available | |
| Cardin David | -- | None Available | |
| Cardin Ft | -- | None Available | |
| Cardin Ft | -- | None Available | |
| Rayner Cynthia | -- | -- | |
| Cardin David | $715,000 | -- |
Source: Public Records
Mortgage History
| Date | Status | Borrower | Loan Amount |
|---|---|---|---|
| Previous Owner | Cardin David | $470,000 | |
| Previous Owner | Rayner Cynthia | $40,000 |
Source: Public Records
Tax History
| Year | Tax Paid | Tax Assessment Tax Assessment Total Assessment is a certain percentage of the fair market value that is determined by local assessors to be the total taxable value of land and additions on the property. | Land | Improvement |
|---|---|---|---|---|
| 2024 | $15,961 | $1,239,200 | $402,500 | $836,700 |
| 2023 | $13,854 | $1,014,200 | $372,800 | $641,400 |
| 2022 | $12,042 | $824,800 | $315,900 | $508,900 |
| 2021 | $12,200 | $797,900 | $287,100 | $510,800 |
| 2020 | $11,397 | $759,300 | $280,000 | $479,300 |
| 2019 | $10,526 | $689,300 | $252,000 | $437,300 |
| 2018 | $10,024 | $640,900 | $237,600 | $403,300 |
| 2017 | $8,909 | $586,900 | $233,000 | $353,900 |
| 2016 | $8,075 | $544,900 | $233,000 | $311,900 |
| 2015 | $8,025 | $536,100 | $224,000 | $312,100 |
Source: Public Records
Map
Nearby Homes
- 5 Lewis St
- 1 Sweeney Ct
- 67 High St
- 20-22 Florence St
- Lot 7 Weeping Willow Dr
- 22 Railroad St Unit 407
- 33 Chestnut St Unit 2
- 2 Powder Mill Square Unit 2B
- 96 N Main St Unit 3
- 100.5 Main St Unit Q
- 50C Washington Park Dr Unit 10
- 3 Torr St
- 105 Central St
- 16 Balmoral St Unit 214
- 1 Longwood Dr Unit 105
- 354 N Main St Unit 214
- 42 York St
- 15 Alcott Way
- 53 Salem St
- 37 Crenshaw Ln Unit 37